


The pulse of the digital asset market continues to be dictated by macro liquidity, with Bitcoin closely mirroring global liquidity shifts, albeit with a 70-day lag. As indicated a decline in Global Liquidity Index, BTC price action mirrored the backdrop.

After reaching a new all-time high (ATH) of $111,970.17 on May 23rd, BTC has since retraced to around $104,600, reflecting a cooling market amid tightening macro liquidity. However, this price action is not isolated but reflects the dynamic interplay between liquidity as a leading indicator and technical levels as confirmation triggers. However, technical rejection at the main resistance zone, as highlighted in our previous The Insider, 19th May would imply a significant shift in sentiment

If BTC fails to reclaim resistance and this could lead to a rolls over. In this scenario, a clean break below the psychological $100,000 mark, and more critically, below the $92,000–$93,000 support zone, would open the door for a deeper retracement. This area has acted as a liquidity gap post election, meaning a break could trigger accelerated declines down to the $80,000–$84,000 range, or even as low as $68,000, where the next major support band lies.
This interplay between liquidity and price is pivotal:
If liquidity leads, we should expect a swift recovery from this correction, potentially flipping market sentiment bullish again by mid-next week.
If price action leads, via a failed resistance retest and a decisive break lower liquidity may follow into a tightening cycle, reinforcing risk-off behavior.
BTC’s dominance continues to climb, currently 5 percentage points higher since the start of the year, underscoring the classic flight-to-quality dynamics and inflows. This dominance not only signals risk aversion but also highlights BTC as the primary beneficiary of any liquidity rebound. The next few trading sessions will be crucial in determining whether liquidity leads price into a recovery or if price action triggers liquidity tightening, setting the stage for a broader correction.
Altcoin Rotation
The Altcoin market (Total Market Cap ex-BTC) chart reveals a decisive rejection of resistance, indicating that the market’s appetite for riskier assets is fading.

The altcoin market, currently trading with a 1.55 beta to BTC, exhibits both heightened volatility and a more pronounced sensitivity to BTC’s directional moves.

This elevated beta signals that altcoins are particularly exposed to broader risk-off sentiment. Historically, Total2’s rejection at key resistance levels has coincided with sustained corrections in altcoin markets.
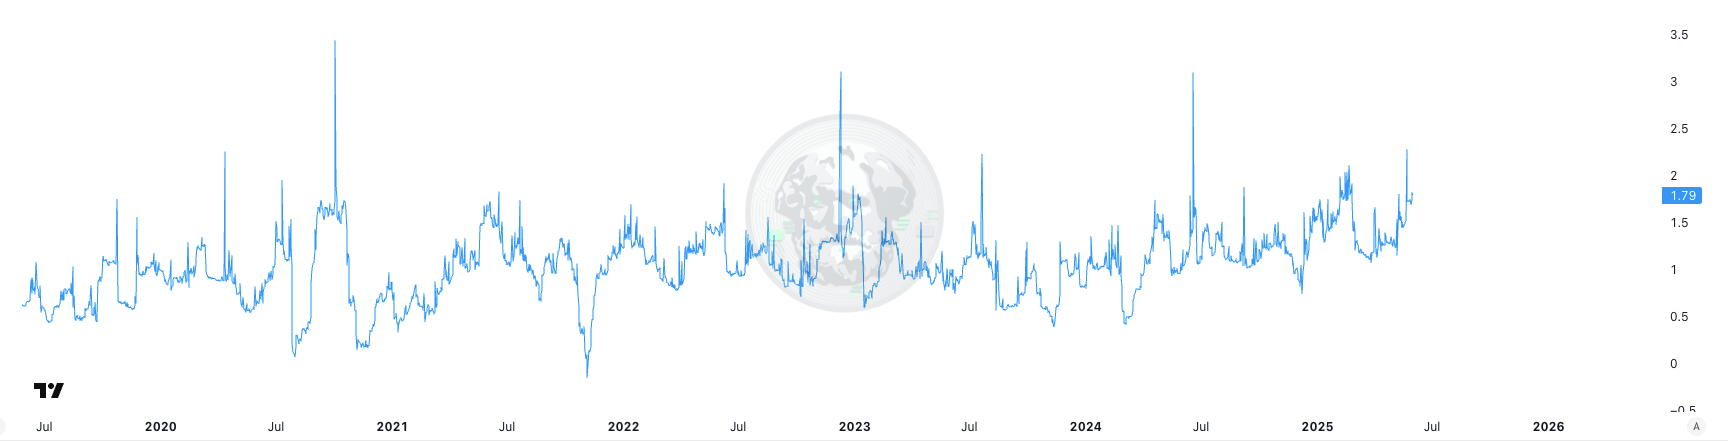
Even more concerning is the performance of the OTHERS/BTC ratio, which tracks total market ex top 10 assets relative to BTC. This index has broken below multi-year support levels, marking a pivotal shift in market structure.

With a 1.79 beta to BTC, the current configuration suggests that altcoins are underperforming BTC with significant volatility. This breakdown isn’t just technical, it reflects a structural flight from high-risk assets as liquidity tightens.
Compounding these pressures is the pending wave of $9 billion worth of token unlocks over the next 90 days, representing 3.6% of the total OTHERS index.

Historically, large unlock events create local supply gluts, particularly for tokens with limited liquidity and weak fundamental support. This backdrop is likely to trigger sharp price adjustments, especially in thinly traded altcoins, and could accelerate the existing trend of rotation into BTC.
The Selective Outperformance
A closer look at relative performance data over the past 90 days highlights the selective nature of capital flows.

Of the top 200 tokens, only 19% have outperformed BTC.
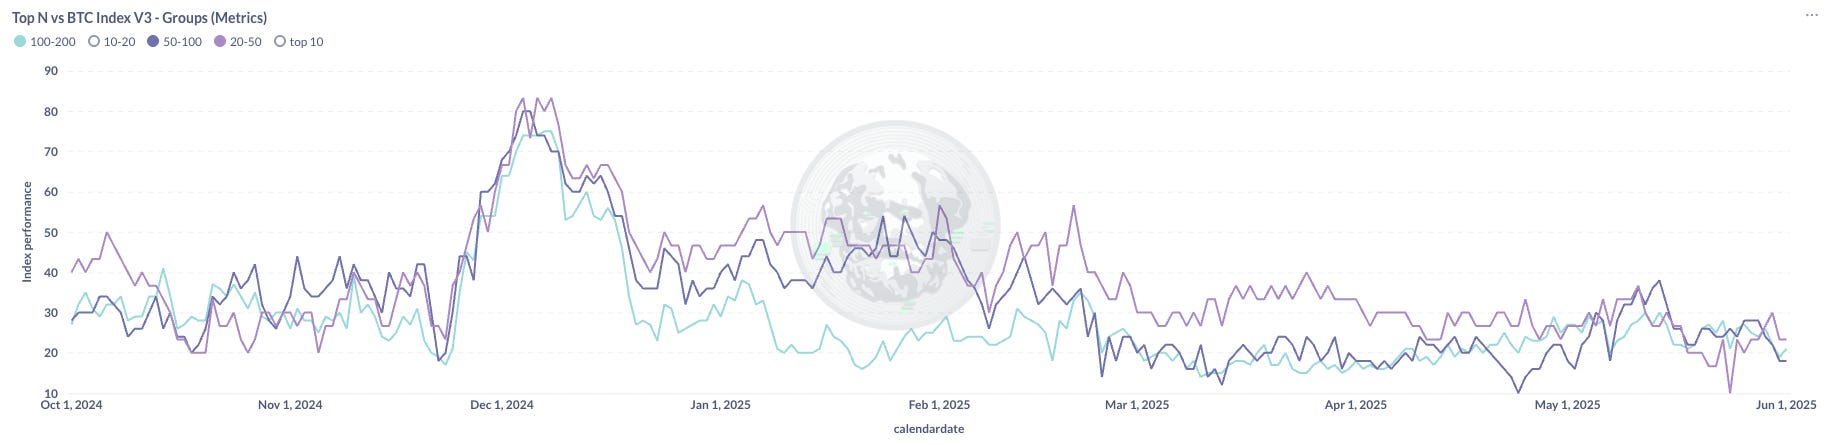
This limited outperformance is further stratified by market capitalisation tiers:
20–50 mcap bracket: 30% of tokens have outperformed BTC, suggesting mid-cap strength and concentrated alpha.
50–100 and 100–200 brackets: Only 22% of tokens have outperformed BTC, revealing a more challenging environment for smaller caps.
This dispersion emphasises that while speculative appetite is waning overall, investors are still willing to allocate capital to select projects that demonstrate strong fundamentals, solid narratives, and sustained user engagement. The market is effectively rewarding quality and punishing mediocrity, a trend likely to persist as macro conditions tighten.
Interestingly, the concentration of alpha generation in the 20–50 bracket may signal that the market is in an intermediate phase of risk-off, where capital is still seeking returns but is increasingly selective. This middle ground could represent a tactical opportunity for savvy investors, but with heightened volatility and downside risk, discipline and precision are essential.
DeFi: Shifts in Market Structure
While macro liquidity sets the stage, the evolving market structure in DeFi continues to reshape trading behaviour. As we forecasted in our 2025 outlook, the DEX-CEX ratio has continued its ascent, closing May at 25%, surpassing our projected >20% by H1 2025.

This shift isn’t a flash in the pan; it represents a broader market preference for transparency, self-custody, and composability inherent in decentralised exchanges (DEXs).
The $409 billion in DEX volume for May, the second-highest total on record, underscores the resilience and growth of on-chain trading infrastructure.

Notably, 82% of this volume was generated on Layer 1 (L1) blockchains, with Binance Smart Chain (BSC) emerging as the standout performer. Capturing a 41% share of total DEX volume, and commanding over 60% of L1 trading volume during the final two weeks of May. As we highlighted in our The Distribution Imperative, only a handful of players possess the scale and distribution channels necessary to drive such substantial on-chain volume, and BSC is one of them.

This underscores a critical dynamic: distribution is pivotal for adoption. Platforms that have already built and consolidated user bases are well-positioned to capitalize on demand for on-chain adoption.
Furthermore, the rise in cross-chain bridges, Layer 2 rollups, and modular infrastructure is enabling DEXs to offer increasingly competitive user experiences relative to centralized venues.

A very similar pattern can be seen on the L2 side, with Base dominating the volumes as L2s have been taking market share of L1s, its mainly Base related.
Perpetual DEXs
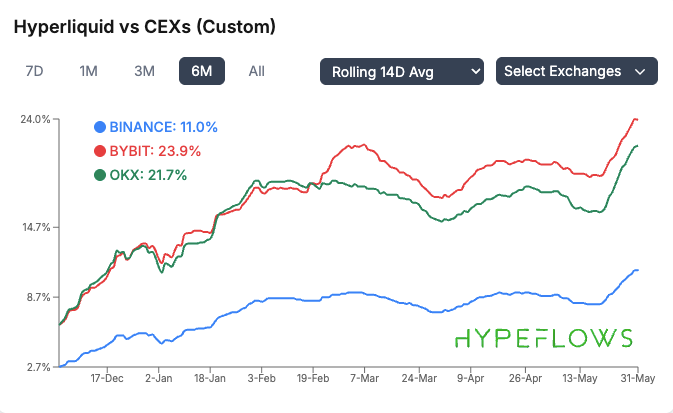
Perhaps the most significant shift has occurred in the perpetual DEX space. The perp DEX to CEX ratio continues to expand, propelled by Hyperliquid’s rapid rise.

Hyperliquid now accounting for an impressive 55-75% of total perpetual DEX volume, its success is a testament to its liquidity depth, innovative product offerings, and focus on user experience.

Notably, its trading volumes are now equivalent to 11% of Binance’s perp market volume, signaling a material shift in trader preferences toward on-chain derivatives.
This evolution has profound implications. Perpetual DEXs are not only capturing market share from CEXs but also redefining how leverage and liquidity are accessed in the digital asset ecosystem. However, this dominance also introduces concentration risk. With Hyperliquid controlling such a significant share of perpetual trading, any operational disruptions or liquidity shocks could reverberate across the market.
Looking ahead
As we move into the summer months, the landscape remains finely balanced. Liquidity is rising and is expected to remain supportive until mid-summer, but with price action still under pressure, caution is warranted.
In this environment, a selective approach is essential. While macro conditions may eventually provide a tailwind, not all assets are positioned to benefit equally. We continue to favour key altcoin names with strong fundamentals, projects demonstrating product-market fit, solid user bases, and clear narratives. These assets are best equipped to weather near-term volatility and capitalize on renewed capital flows when market conditions improve.
At the same time, we remain cautious on broader exposure, as liquidity plateaus into mid-summer could coincide with seasonal slowdowns and a continued correction in weaker assets. Careful positioning, discipline, and a focus on quality will be critical to navigating this transitional period.