


Bitcoin’s price action took a breather this week, correcting as we projected in the last weeks The Insider and finding support around the ~$100.6K zone.
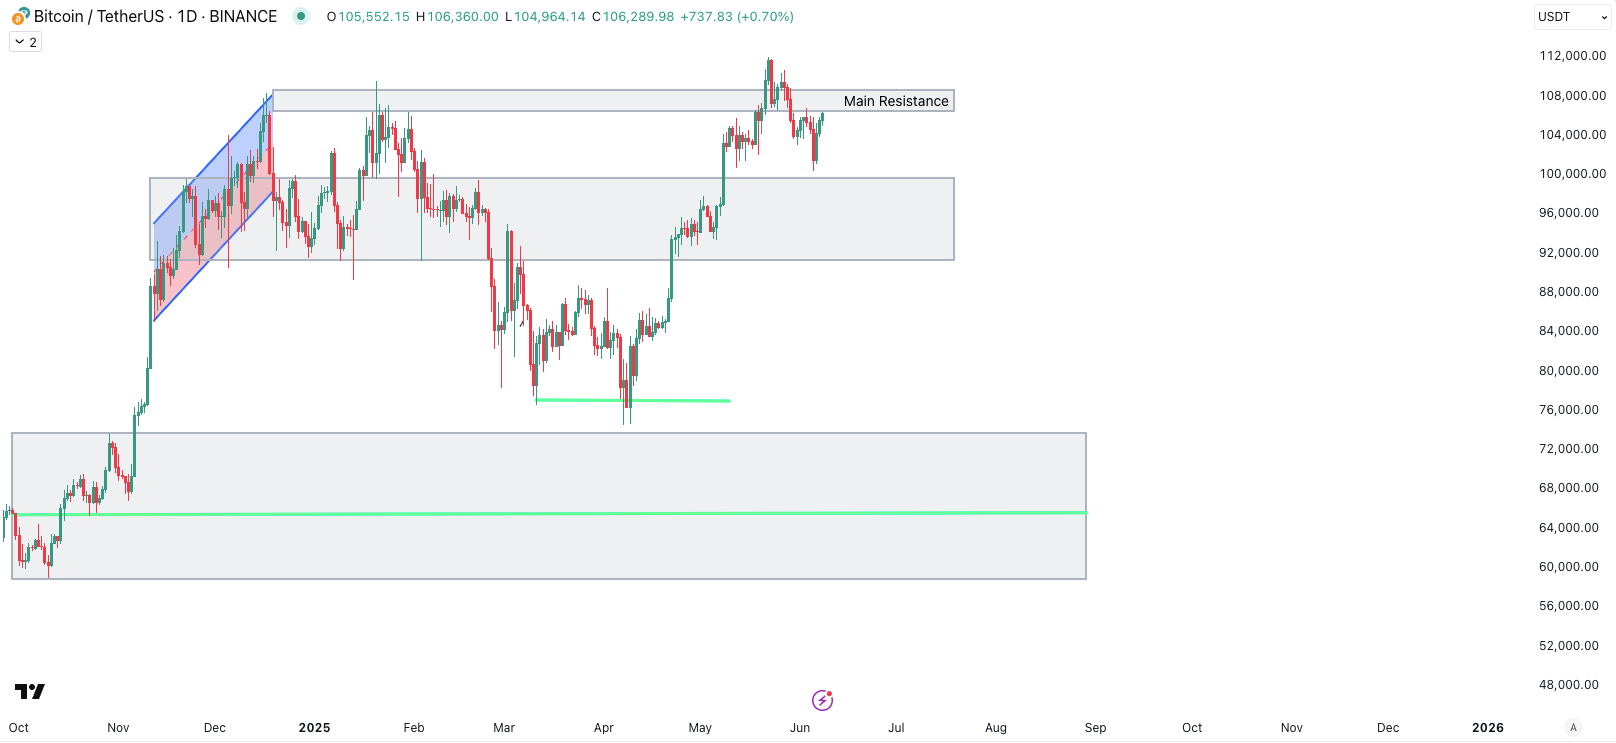
After that healthy pullback, BTC rebounded and is now retesting major resistance in the $106K–$108K area. This level coincides with a key Fibonacci retracement and a former support from May, which has turned into overhead resistance. So far, the recovery has been methodical: higher lows are intact, and dips are being bought, but bulls have yet to definitively clear the heavy supply zone just above $106K.
Notably, the correlation between Bitcoin’s price and global liquidity remains intact for now. As projected, last week saw a modest dip in global liquidity, and BTC followed with a pullback from its recent highs a move that reaffirms the typical lagged relationship between the two.

Historically, BTC tends to trail changes in global M2 by around 8–10 weeks, with rallies fuelled by liquidity expansions and retracements often mirroring tightening or flattening liquidity conditions
The broader liquidity backdrop is approaching an inflection point. Global liquidity nudged higher to $176.6 trillion, but the rate of expansion is clearly fading. At the same time, the U.S. Treasury is confronting a massive refinancing wave, with $9.2 trillion in maturing debt this year, over $5 trillion of which is due by the end of June. This issuance surge arrives as central bank balance sheets remain flat, raising the risk of tightening conditions in Q3. For now, Bitcoin continues to ride the tailwind of Q1’s $5 trillion liquidity expansion, but as issuance accelerates and demand is tested, macro headwinds are gathering.
In this context, BTC’s current battle at resistance is more than technical, it’s a sentiment check on liquidity expectations. If liquidity fails to re-accelerate, this rally may stall. But if markets begin pricing in renewed stimulus or successful absorption of debt supply, price momentum may continue to front-run fundamentals.
Ethereum & ETF Inflows
Institutional flows are rotating into Ethereum in a big way. Over the past two weeks, ETH-focused ETFs have seen roughly $630 million of inflows, with about $281 million coming just in the last week. In the same week, Bitcoin ETFs had net outflows of approximately $128–129 million.

This stark divergence is indicating a first sign of rotation into alts. It’s now a 15-day streak of inflows for ETH funds, bringing total ETH ETF AUM to new highs.

Drivers include Ethereum’s strong price performance and recent changes in narrative around Ethereum Foundation.
Regulatory developments are also influencing the Ethereum ecosystem. Late May, the SEC’s Division of Corporation Finance issued new guidance on proof-of-stake (PoS) crypto staking, stating that typical staking activities (running validators, delegating to pools, etc.) do not constitute an offer or sale of securities. This was a significant clarification, essentially green-lighting companies to offer staking services in the U.S. without fear of immediate SEC enforcement. It opens the door for novel ETF products that could incorporate staking yields (for example, an ETF that holds and stakes ETH or SOL to capture staking rewards).
In fact, multiple asset managers have filed for “staking reward” ETFs. However, legal ambiguity remains. Just a day after the guidance, SEC staff raised concerns about two proposed staking-inclusive ETFs (the REX-Osprey Ethereum + Staking ETF and Solana + Staking ETF).
Nonetheless, the overall tone from regulators on PoS is more positive than earlier in the year, and it reinforces Ethereum’s appeal (as the largest PoS network) for institutional investors looking ahead.
Altcoin Market
The total cryptocurrency market cap excluding BTC (Total2) continues to trade in a cautionary pattern. As of this week it sits near $1.16 trillion, after failing to break out of a long-term downtrend.

Total2 was repelled at a major confluence of resistance, the descending trendline from early 2025’s peak and the horizontal supply zone around $1.2–1.3 trillion. This double-top/descending trendline rejection occurred in late May and has kept the altcoin market in check. In effect, altcoins as a whole have not confirmed a bullish trend reversal and remain in a consolidating state under heavy resistance.
Year to date, almost all major altcoin sectors have underperformed BTC, with only a handful managing to outperform ETH.

The sector relative strength chart shows broad weakness across DeFi, infrastructure, L1s, and L2s highlighting that risk appetite for non-BTC assets remains muted. By looking at Mcap category, the only positive market group year-to-date are the Mega Cap, which indicate a low willingness to go further out the risk spectrum.

The YTD and 30D token performance distributions confirm the same story: the market is rewarding quality, punishing hype.
Only 4 protocols have outperformed BTC year-to-date.
The vast majority of assets are trading at a loss, with median YTD performance at -51%.

In the last 30 days, dispersion remains elevated, with a few standout gainers amid broad underperformance. Only 16-17% have outperformed BTC, with the median performance at -11.5%.

This dispersion underscores that investors are growing increasingly selective, prioritising projects with strong fundamentals, real revenue, active users and attention. In contrast, speculative or thinly traded tokens especially those lacking traction or plagued by large unlock schedules are being actively avoided.
Stablecoins
Stablecoin supply has reached a new all-time high, marking a full recovery from the 2022–2023 deleveraging cycle. The total circulating supply now exceeds $247.2 billion, with dominant growth from USDT and rising contributions from newer issuers.

This surge in supply reflects a growing pool of sidelined capital a risk-sensitive cohort that prefers liquidity and optionality over immediate exposure.
While BTC is hovering near its all-time highs and institutional flows are returning to ETH, altcoins continue to underperform, and on-chain interest rates remain subdued.

Yield benchmarks across major protocols are still below risk-free rates, particularly on blue-chip lending, underscoring the structural imbalance between capital supply and organic demand.
Looking at stablecoin net flows show a generally positive but tapering trend, with the 14-day moving average of inflows declining through early June.

This suggests that appetite for risk has plateaued, capital is still entering the system, but with less urgency. It aligns with broader market behaviour: BTC dominance is rising, altcoins are struggling, and participation is increasingly concentrated in fewer, higher-quality assets.
Looking ahead
As Q2 draws to a close, markets are entering the seasonally quieter summer window, a period typically marked by lower volumes, and thinner liquidity. As we move further along the month, many investors are choosing to de-risk, and wait for clearer signals. In the absence of a strong catalyst, this range-bound, low-conviction environment could easily persist through July and August.
That said, beneath the surface, several potential flashpoints could still shift the landscape:
Macro catalysts: A surprise in U.S. CPI, either hotter or colder than expected, could alter Fed trajectory, reprice interest rate expectations, and trigger a cross-asset volatility spike.
ETF developments: Progress on spot Ethereum or Solana ETFs, or a regulatory green light for staking-linked ETF products, could unlock new inflows and reshape market narratives.
Fiscal or credit stress: A breakdown in U.S. fiscal negotiations, or disruptions in debt and credit markets, could force a repricing of risk and liquidity, especially as the Treasury’s refinancing burden intensifies.
Until such catalysts materialise, we expect a market characterised by choppiness, selective rotation, and tactical trades. Broad trend-following strategies will likely underperform, while idiosyncratic strength—assets with real user activity, institutional alignment, or strong narrative will continue to lead.
The crypto market remains firmly in a transitional phase. The liquidity tailwinds that powered Q1 are fading, and although price action is attempting to front-run fundamentals, conviction is lacking. We are in a “quality over quantity” regime, capital is consolidating in assets with structural durability.
We remain selective and flexible: overweighting high-conviction assets, underweighting fragility, and positioning nimbly around macro inflection points. The groundwork for the next major move is being laid, but until the liquidity or regulatory backdrop evolves, patience and precision remain paramount.
This summer might feel quiet until it suddenly isn’t.