


This week: BTC -3%, ETH -7%, SOL -1.5%, Total -2.6%
Despite strong U.S. jobs and cooling inflation that should have been bullish for risk assets, crypto spent the week grinding lower. Bitcoin consolidated around $69k unable to break resistance, Ethereum closed at $1,945 after failing to reclaim $2,200, and total crypto market cap slipped to $2.48 trillion after breaking critical support. The weakness wasn’t isolated to digital assets, it was part of a broader repricing of long-duration growth assets as concerns about AI capital expenditures and software business model disruption rippled through technology markets.
Crypto
Bitcoin remains trapped in a well-defined range after the violent flush to $60k on February 5-6 that produced $2 billion in liquidations and $8.7 billion in realised losses, the second-largest loss event since 3AC collapsed. Multiple attempts to break above $72k failed this week, with each rejection on declining volume.
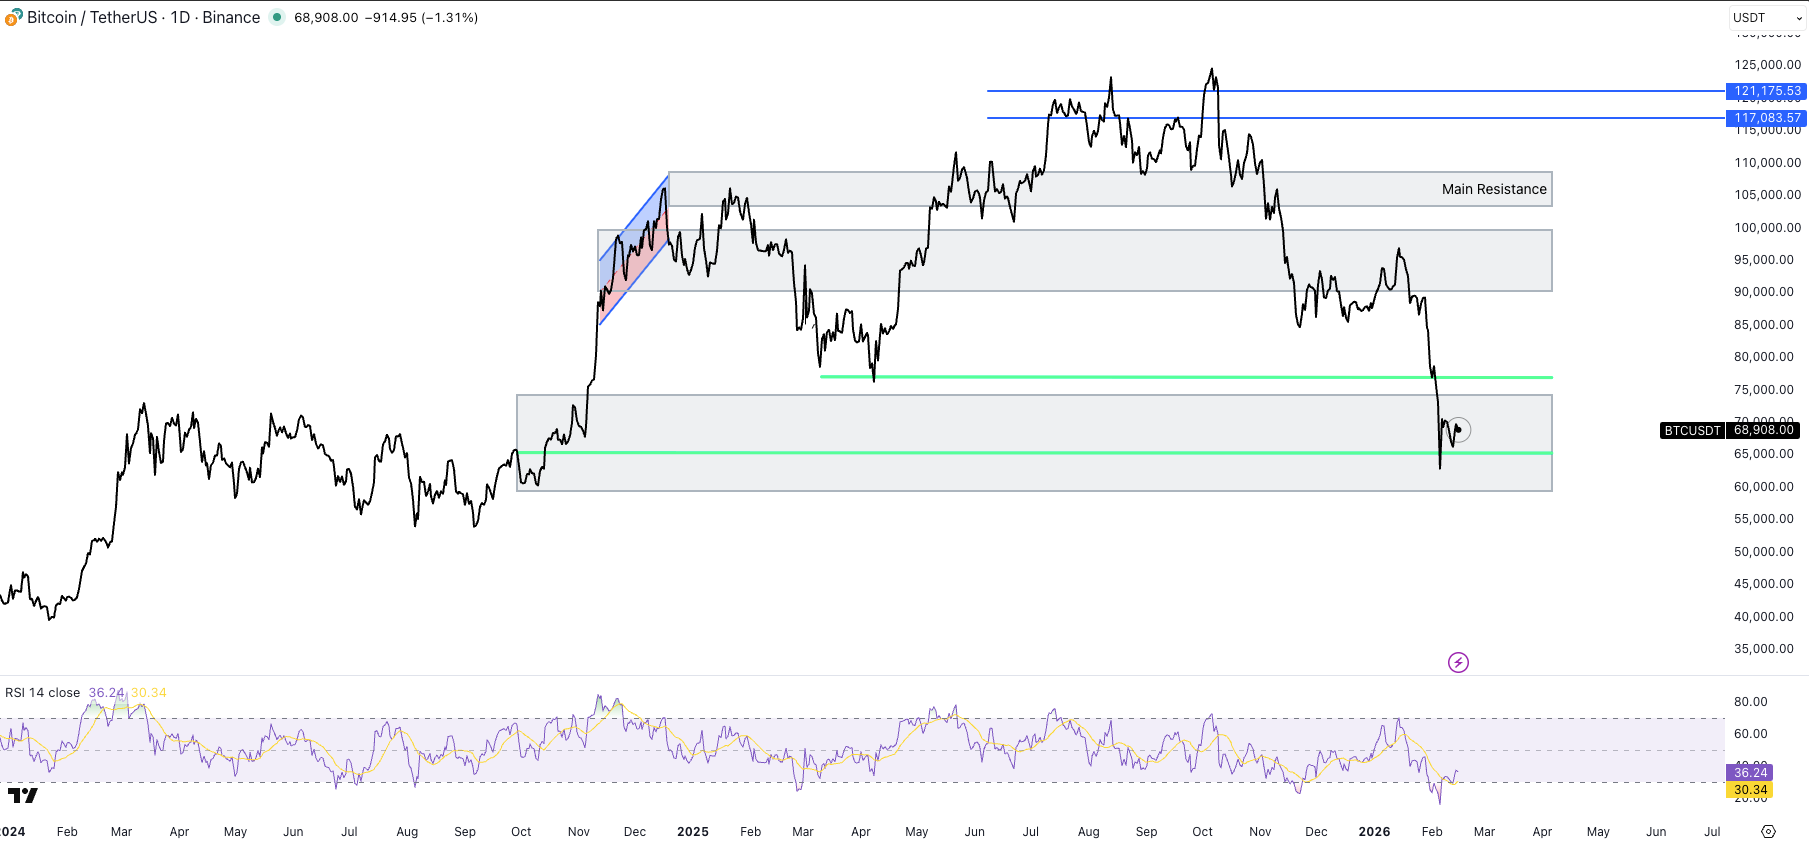
The $75-78k zone needs reclaiming for any structural repair, while $85-90k represents clear overhead resistance. On the downside, $60-62k that held during the early February panic remains critical support. A sustained break below that level would open the door to the mid-$50s and potentially trigger another wave of forced liquidations.
Ethereum's technical damage is more severe. Down 7% for the week to $1,945, the prior support zone at $2,200-2,300 has now flipped to resistance. ETH fell roughly 26% peak-to-trough during the early February selloff, briefly trading below $1,800 before recovering.
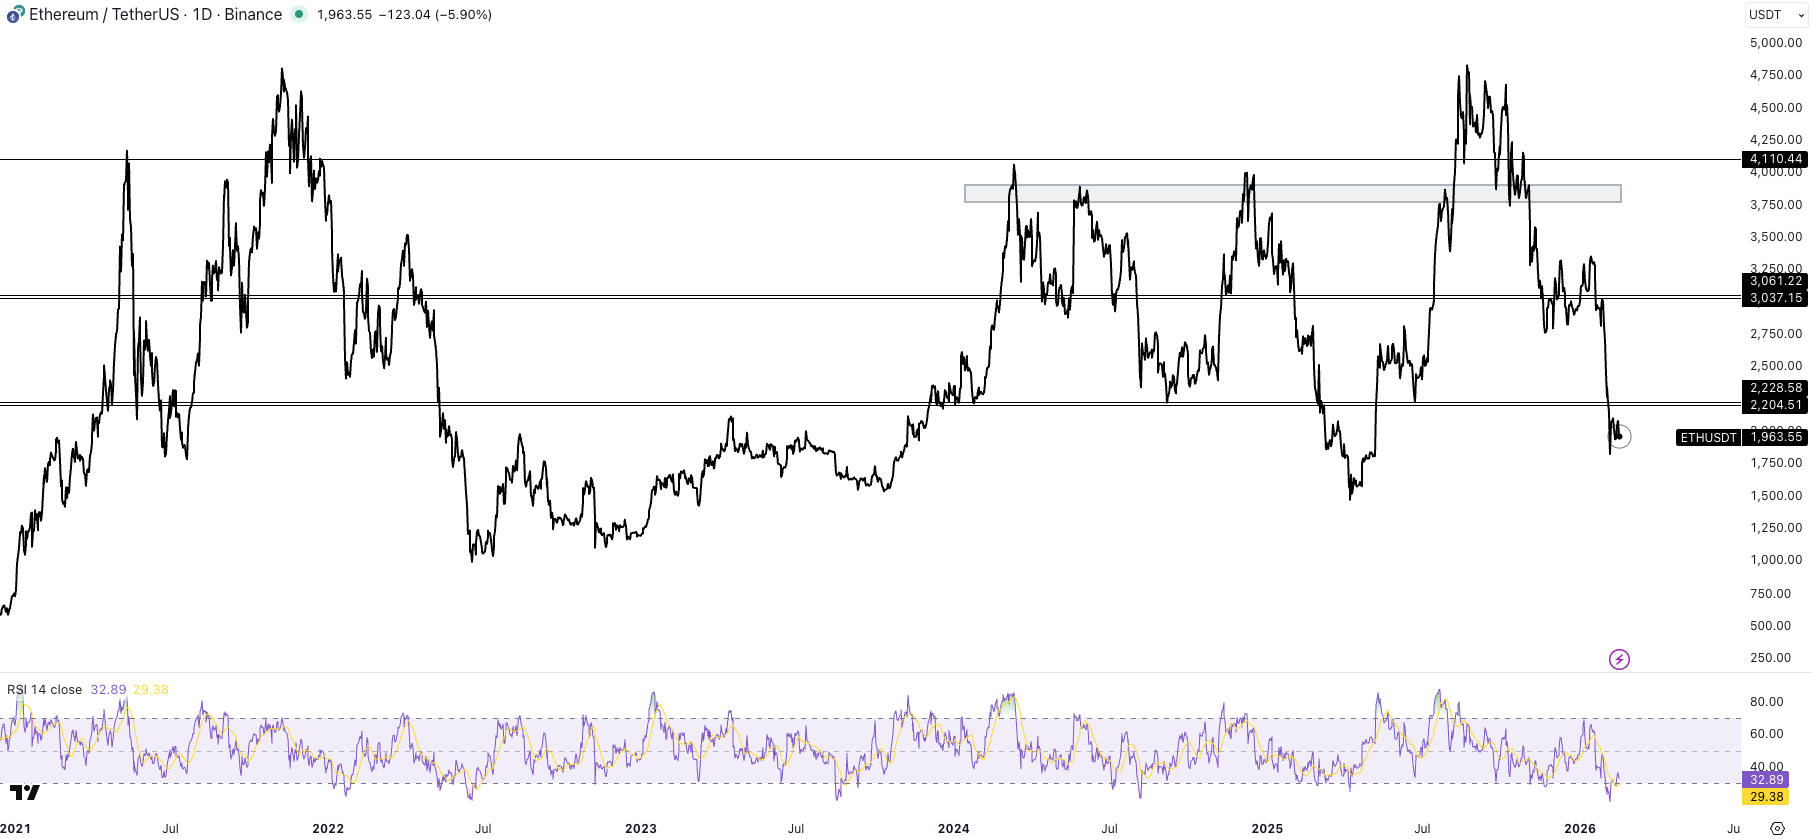
The failure to reclaim $2,200 this week confirms continued underperformance versus Bitcoin and reflects Ethereum's higher sensitivity to tightening liquidity conditions. Relative strength continues to favor Bitcoin as capital rotates toward perceived safety within crypto.
The total crypto market cap breaking $2.45 trillion was the week's most critical technical event. This level had acted as medium-term support throughout late 2025. Once it failed decisively early in the week, selling cascaded with minimal bids until closer to $2.0 trillion.
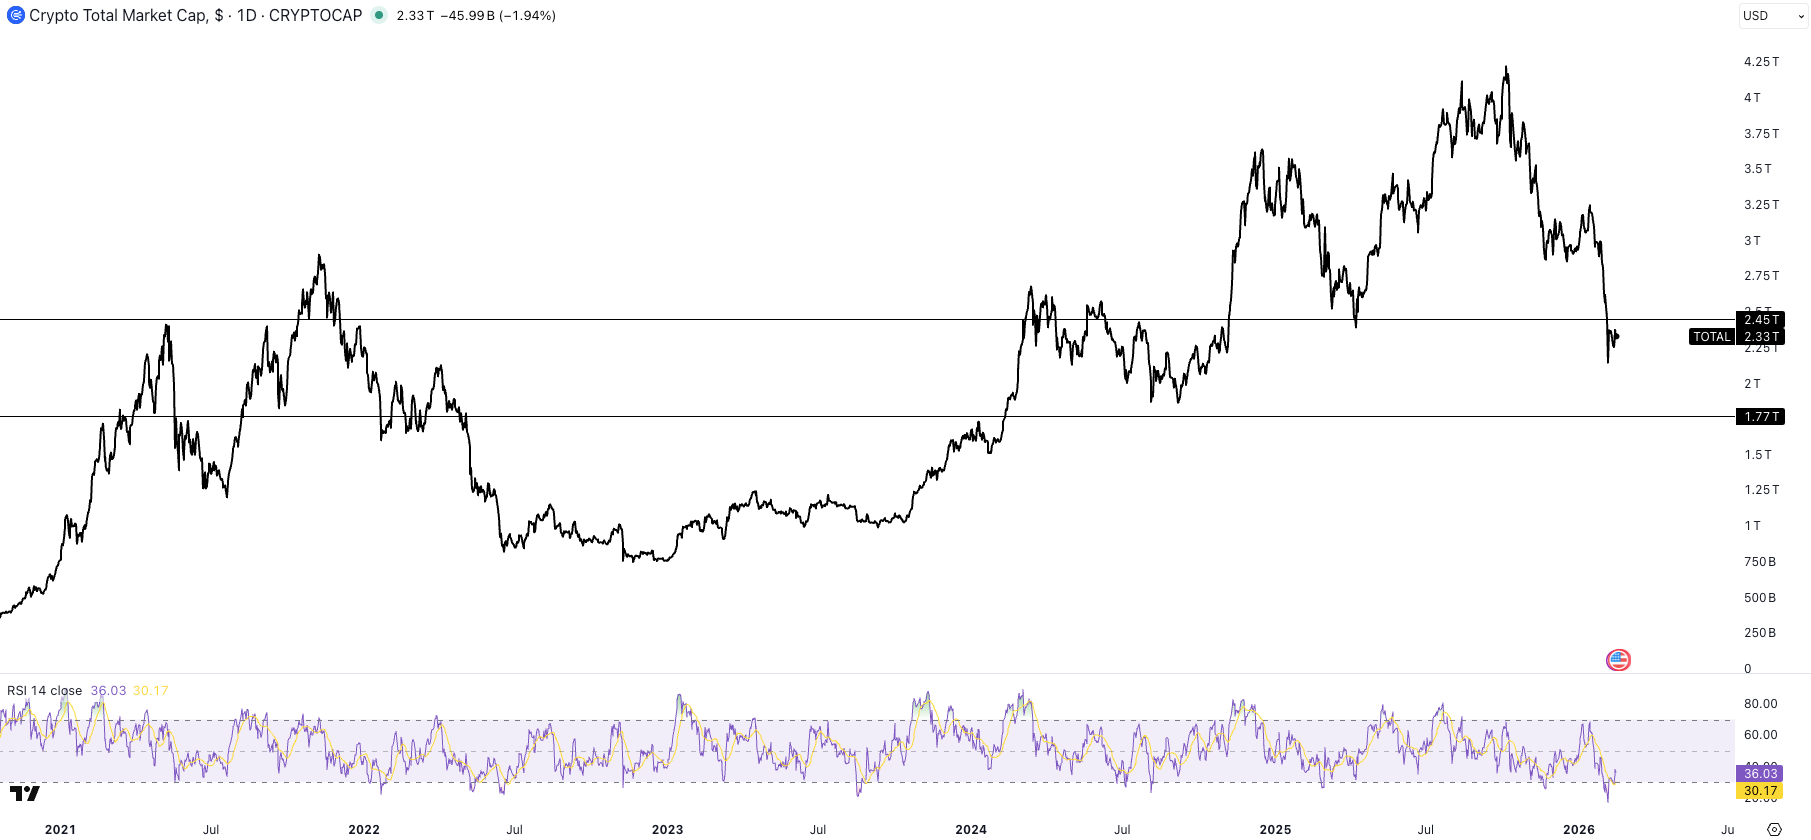
The breakdown was broad-based: large caps, mid caps, and high-beta altcoins all sold off together with no rotation into defensive segments. Bitcoin dominance rose to 58-59% as capital fled everything else, confirming this was a liquidity-driven move rather than a narrative-based rotation.
The Software Correlation That Won’t Break
The most important structural development for crypto continues to be the deepening correlation with software equities. Bitcoin now trades with 0.73 correlation to IGV (iShares Tech-Software ETF), actually higher than its correlation to the broader Nasdaq. This isn’t random noise. It’s the market telling you exactly what Bitcoin has become: a leveraged bet on the same growth thesis that underpins software stocks.
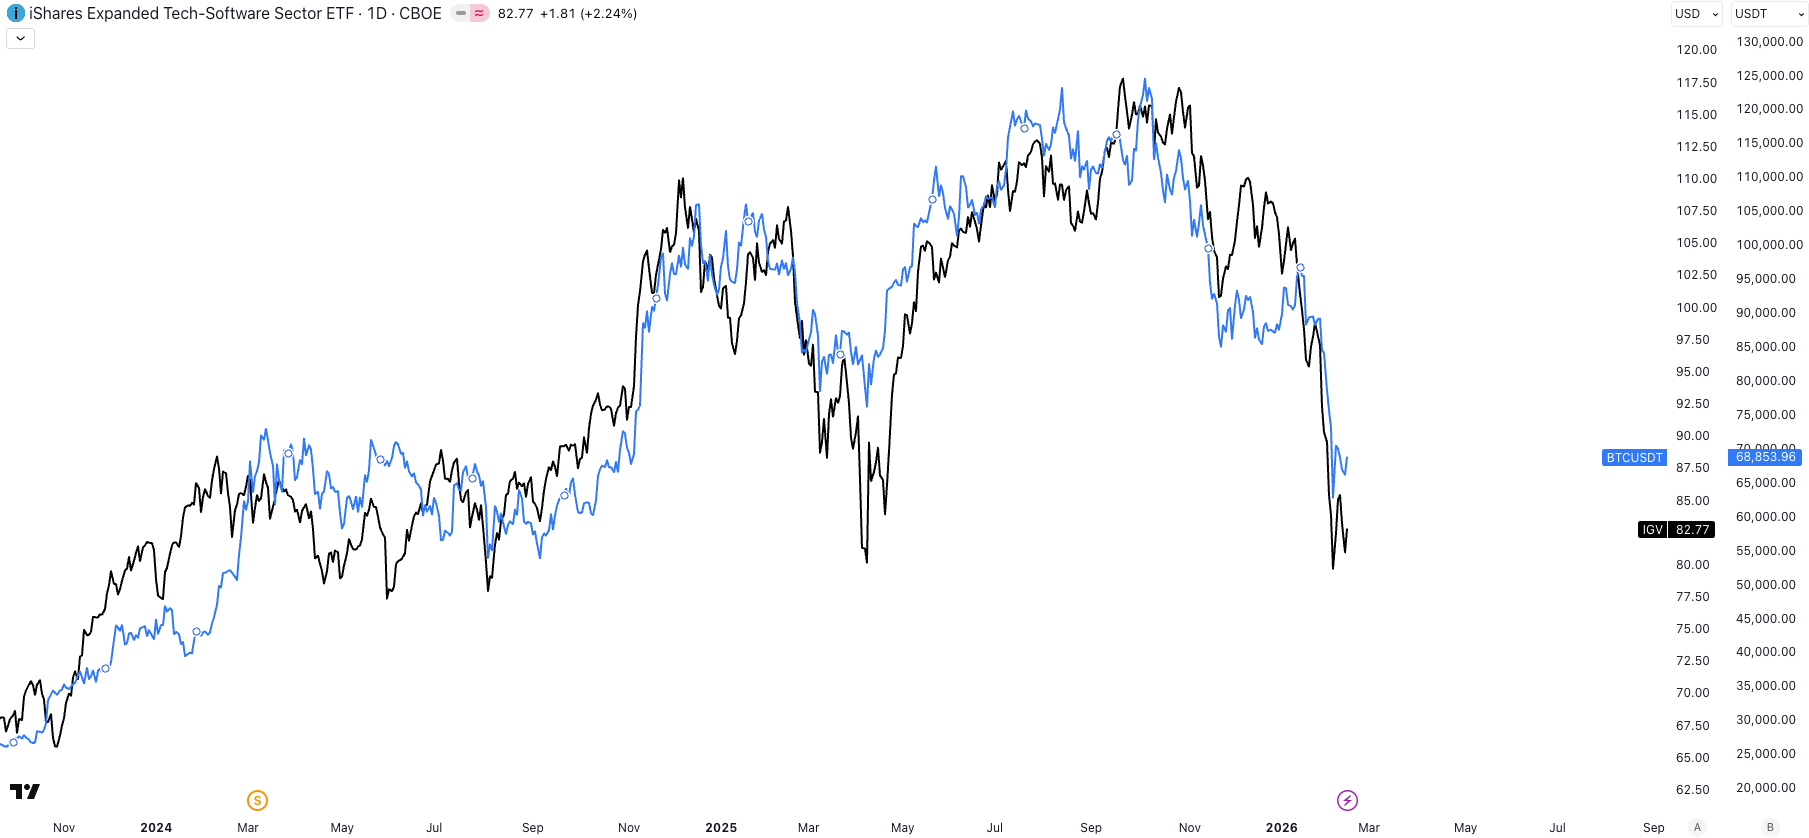
IGV closed at $82.77, down 22.7% year-to-date and 29.75% from its September 2025 peak, officially in bear market territory.
The damage to individual names is severe (from peak):
Microsoft -26%
Oracle -56%
Salesforce -28%.
January 2026 was IGV’s worst month since October 2008, and February isn’t providing any relief.
The selloff is being driven by mounting evidence that AI tools will disintermediate software margins faster than they create new revenue streams. Tools that can automate legal work, customer service, coding tasks, and enterprise workflows are forcing investors to question the entire SaaS business model built on per-seat licensing and predictable recurring revenue. As software multiples compressed throughout the week, Bitcoin followed almost tick-for-tick.
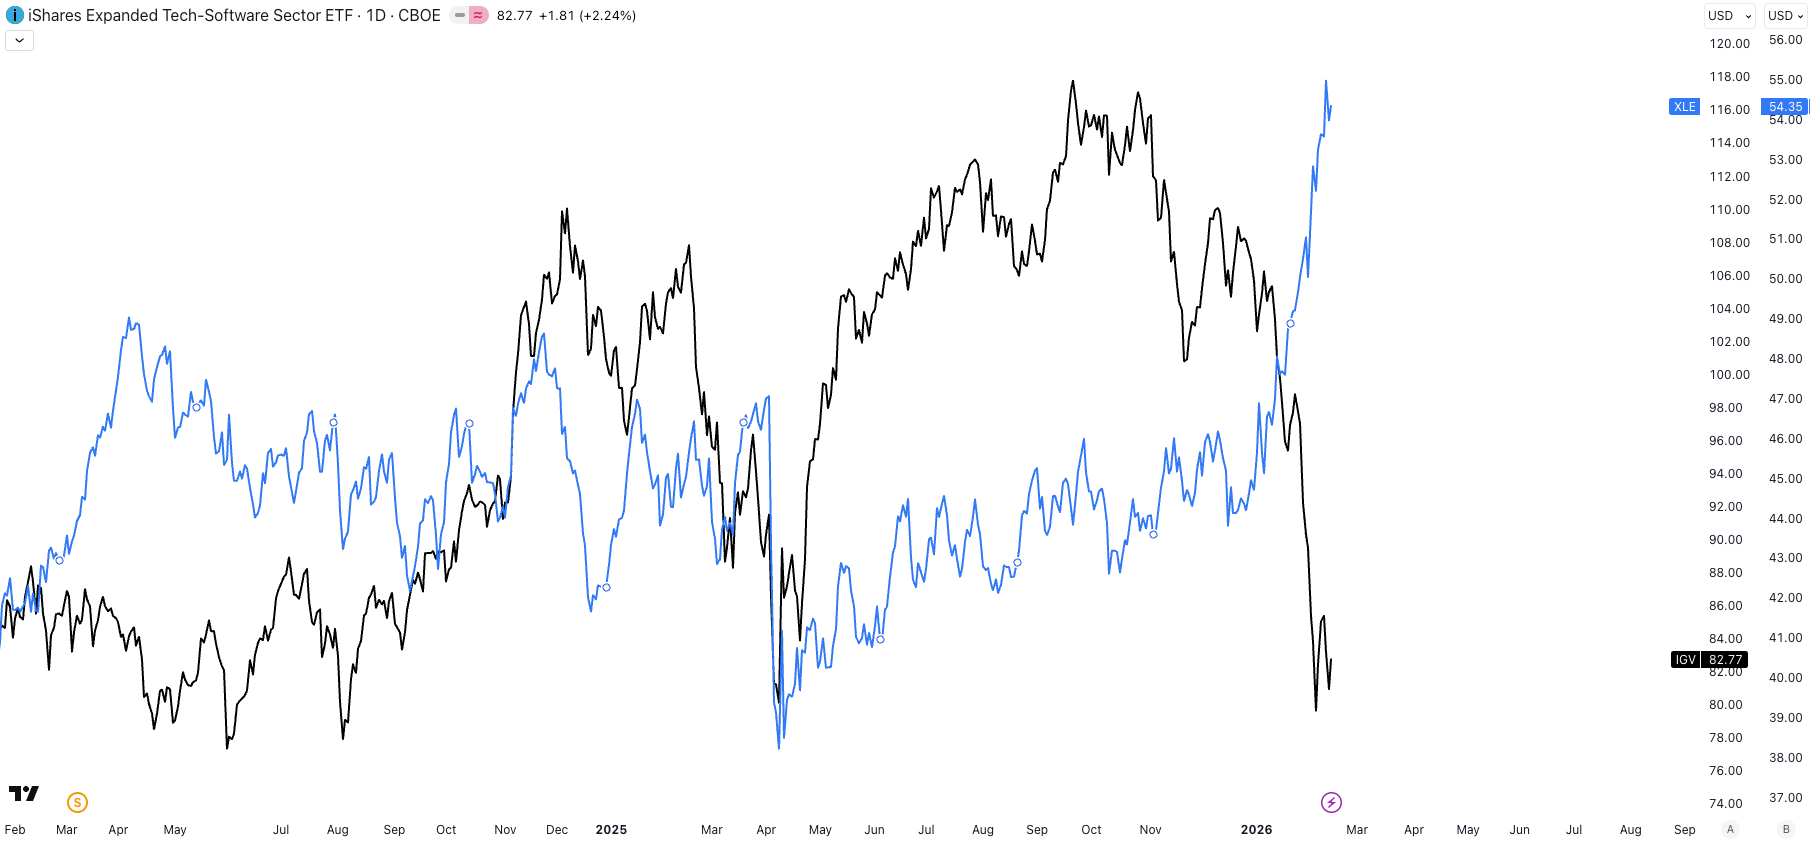
Meanwhile, one of the most dramatic sector rotations in modern market history continues to accelerate. The Magnificent 7 stocks are down 6.27% year-to-date while the Energy Select Sector SPDR (XLE) has surged approximately 23%, creating a roughly 25-percentage-point performance spread. This is the kind of violent rotation that only happens at major market inflection points.
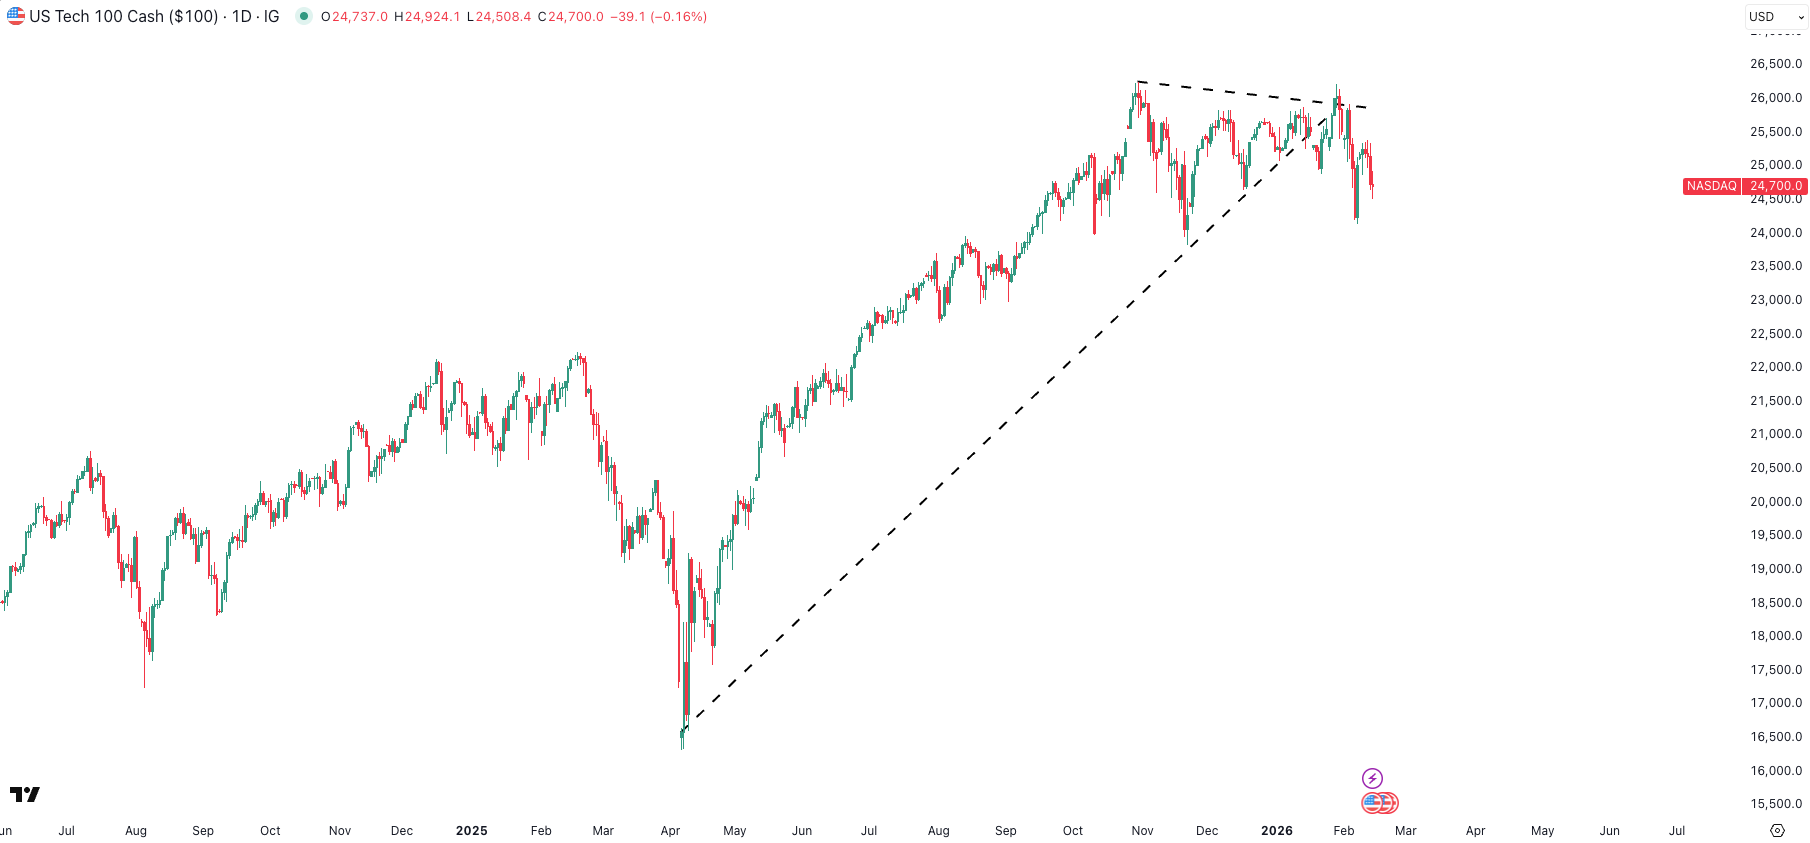
The Nasdaq fell roughly 7% during the selloff period, driven primarily by forward guidance around AI capital expenditures rather than current fundamentals. Several large technology firms signalled meaningful increases in AI spending for 2026, raising concerns that costs are massively front-loaded while monetisation timelines remain uncertain. Markets responded by compressing multiples across software, cloud infrastructure, and AI-adjacent names. The sequence matters: equities repriced first, IGV followed, and crypto amplified the move as the highest-beta expression of the same trade.
Extreme Sentiment, Missing Buyers
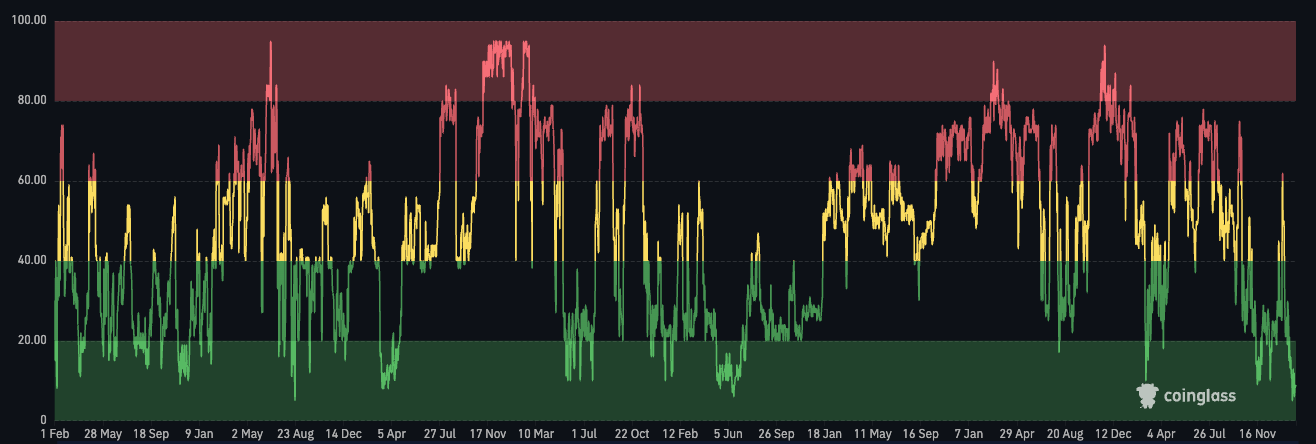
The Crypto Fear & Greed Index hit an all-time record low of 5 on February 6, even worse than the FTX collapse, and remained in single digits through February 13 before creeping to 13. These are extreme capitulation-level readings that in past cycles have marked major bottoms.
But here’s the problem: capitulations only mark durable turning points if buyers actually show up. The ETF flow data suggests they haven’t.
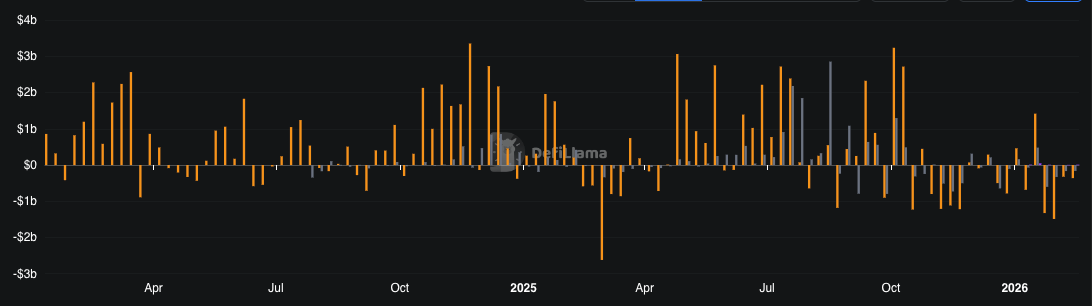
Spot Bitcoin ETFs suffered their fourth consecutive week of net outflows, with roughly $360 million exiting just this week alone. Cumulative outflows since November have reached $6.8-8 billion. Most ETF investors are now sitting on losses, with average cost basis estimated around $84,000-90,000. These aren’t retail weak hands panic-selling, they’re the institutional buyers that everyone said would provide a structural bid under the market.
Macro
This week delivered a paradox that’s essential to understanding market behavior: strong economic data that should have supported risk assets instead triggered broad-based selling.
The January jobs report surprised to the upside. Nonfarm payrolls rose 130,000 versus consensus expectations of 55,000-70,000. The unemployment rate ticked down to 4.3% from 4.4%. Average hourly earnings came in at +0.4% month-over-month (+3.7% year-over-year), and real wages grew a healthy 1.2%.
But benchmark revisions told a much darker story lurking beneath the headline. 2025’s total job creation was slashed from a reported +584,000 down to just +181,000, meaning the U.S. economy averaged only 15,000 jobs per month last year instead of the previously reported 49,000. Healthcare and social assistance accounted for nearly all of January’s gains, while federal government employment fell 34,000 and financial activities shed 22,000.
Two days later, the CPI report came in cooler than expected. Headline inflation fell to 2.4% year-over-year (below the 2.5% forecast), while core CPI dropped to 2.5%, its lowest reading since March 2021. Shelter inflation decelerated to +3.0% annualised, energy fell 1.5% on the month, and core goods were flat.
So we got decent jobs growth and cooling inflation with the Fed on hold at 3.50-3.75%. In a normal environment, that’s Goldilocks and risk assets should rally. Instead, the S&P 500 fell 1.5% for the week while the Equal Weight S&P hit an all-time high. The dispersion between mega-cap tech and everything else is extraordinary.
The bond market is looking through current data points and betting on what AI means for the longer-term inflation and rate trajectory. Despite the strong jobs print, Treasuries rallied hard. The 10-year yield fell 18 basis points to 4.04%, its lowest level since November 2025. The 2-year dropped to 3.40%.
The market is starting to price in that AI will be structurally disinflationary: more output without proportional cost increases. Fed Vice Chair Philip Jefferson acknowledged this dynamic at Brookings, noting productivity gains could be disinflationary even while potentially raising the neutral rate. Post-CPI, fed funds futures repriced to show 61 basis points of expected cuts for 2026, with June emerging as the most likely window.
Alphabet’s Century Bond and AI Financing
This week brought the most symbolically loaded corporate debt deal since the dot-com era: Alphabet priced a $1 billion 100-year bond at 6.125%, the first technology company to issue a century bond since Motorola in 1997.

The historical parallel is uncomfortable. In 1997, Motorola was a top 25 market cap company and the #1 ranked corporate brand in America. Just one year later, Nokia overtook them. After the iPhone, Motorola fell from consumer relevance. Today: 232nd by market cap, $11 billion in sales. J.C. Penney’s 1997 century bond traded for pennies in bankruptcy.
The deal was part of a $31.5 billion offering that drew over $100 billion in orders, funding Alphabet’s $175-185 billion 2026 capex, double 2025.
Total hyperscaler commitments: $660-690 billion
Amazon $200bn
Alphabet $175-185bn
Meta $115-135bn
Microsoft $120bn
Oracle $50bn)
Morgan Stanley projects tech will borrow $400 billion in 2026, 2.4x the $165 billion raised in 2025.
Tech companies have shifted $120 billion+ in AI data center debt into off-balance-sheet SPVs. Meta pays $6.5 billion extra in interest to keep $27 billion off its balance sheet. Oracle has accumulated $248 billion in lease obligations, up 2,239% year-over-year.

The Mag 7’s trailing free cash flow is turning negative as capex consumes operating cash. Big Five 2026 capex of $660-690 billion versus roughly $25 billion in AI services revenue equals a 4% payback ratio. Bank of America estimates AI capex could hit 94% of operating cash flows.
Nvidia’s circular financing deepens. Nvidia invested $2 billion in CoreWeave on January 26 while committing to buy $6.3 billion of CoreWeave capacity through 2032. The loop: Nvidia invests → CoreWeave buys Nvidia GPUs → CoreWeave leases to Microsoft/OpenAI → revenue supports payments → Nvidia books revenue and marks up its stake.
Moody’s notes Oracle’s data centers depend on OpenAI, which won’t be profitable until 2029. If AI monetization disappoints, bondholders may discover they hold claims on overleveraged SPVs whose assets don’t cover the debt.
Our Take
Short-term: oversold, due for relief. Extreme sentiment (Fear & Greed at 8-13, RSI 16.6 during the flush) typically marks washouts. Equal-weight S&P hitting highs while cap-weighted falls is healthy after years of dangerous concentration.
Medium-term: Bitcoin must decouple from the 0.73 IGV correlation or remain collateral damage in the software repricing. ETF outflows confirm institutional appetite is exhausted. Technically, BTC needs $75-78k, ETH needs $2,200, total market cap needs $2.45 trillion. Until these levels are reclaimed, rallies should be treated as tactical counter-trends rather than the resumption of a structural uptrend.
The AI financing dynamics, $120 billion off-balance-sheet, circular vendor deals, century bonds at potential peak, echo late-1990s telecom. That buildout eventually worked but required a brutal bust that wiped out most bondholders first. Central question: will $660-690 billion in 2026 AI capex generate returns to justify it? OpenAI expects losses through 2028. Someone will lose phenomenally.
For crypto: will Bitcoin be treated as a hedge against that potential unwind, or swept up in it as just another liquidity-sensitive growth asset? The 0.73 software correlation says the latter. We remain cautions on the medium term until we see more net liquidity in the system for investors to counter trade.
We believe market is getting closer to fair value on strong names in crypto, however not yet distressed levels.