


Bitcoin stalled at resistance this week, failing to confirm a breakout above the ~$106K zone despite multiple intraday pushes into that area. As highlighted last week, this level marks a major confluence of resistance, a key Fibonacci retracement level and a former support-turned-supply from May, and BTC has yet to achieve a weekly close above it.

Price remains pinned just beneath resistance, caught in a narrow range between $104K and $106K. Until bulls reclaim this band with conviction, upside is likely capped and the broader consolidation continues.
If one believes global liquidity to be a driver, we should see continued upside until the end of June, as the latest M2-adjusted liquidity index, with a 70d lag continues to a an upward path this week, mirroring previous phases where BTC tracked global liquidity higher.
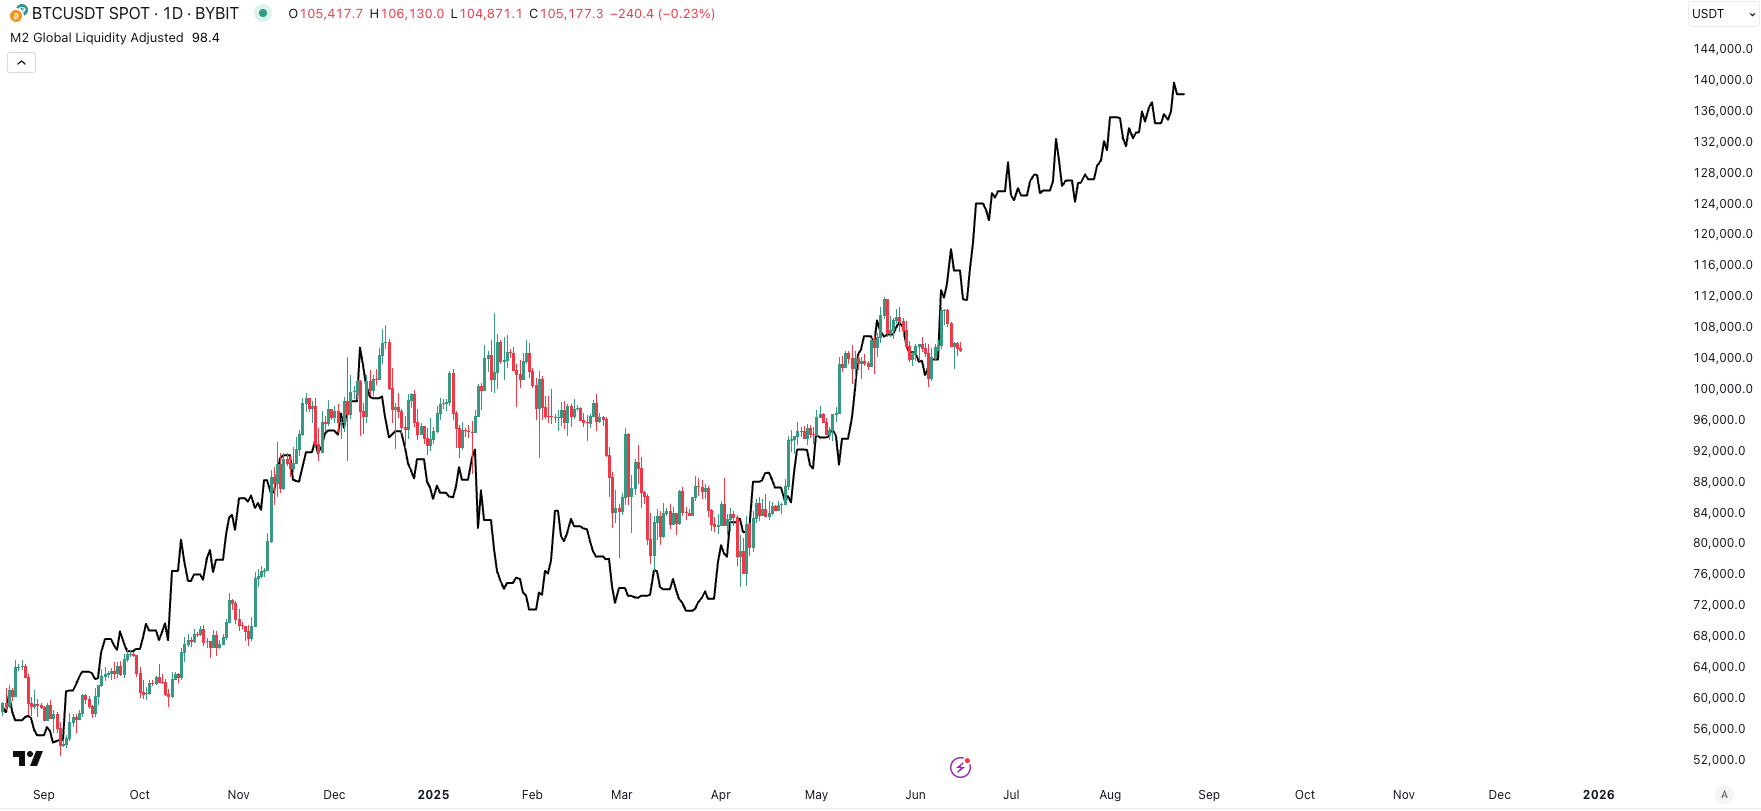
The overall structure remains constructive, with higher lows still intact and dips being bought, but momentum is fading. Without a decisive close above ~$108K, the market risks slipping into another retest of the $100K–$102K zone. The larger support block sits below that, around $88K–92K. So far, this is a standard consolidation, but the burden is now on bulls to reignite price through resistance or risk giving back more of Q1's gains.
Macro: Still No Inflationary Shock
The latest inflation figures offered a welcome surprise: both CPI and PPI for May underperformed expectations, reinforcing the narrative that pricing pressures remain tame despite geopolitical noise and new trade tariffs. While tariffs introduced in April have yet to feed meaningfully into consumer prices, the initial data indicates minimal passthrough at least for now.

Bond markets reacted briefly, with yields dipping on the release, but buyers failed to hold control. Despite several well-received Treasury auctions, fixed income has resumed its erratic drift a sign of deeper uncertainty around the macro path ahead. Traders are increasingly leaning toward a softer stance from the Fed, especially with the July 2026 leadership change on the horizon. The market is currently pricing in four 25bp cuts over the next year

Real policy rates (nominal minus core inflation) underscore just how tight Fed policy remains relative to global peers. Should inflation continue to cool and tariffs prove benign, there's plenty of justification for Fed Funds to move 100bps lower over the next 12 months.

Meanwhile, speculation around Scott Bessent as a potential Fed Chair successor has added another dimension. If confirmed, markets may start to price an even more accommodative trajectory. Historically, global rate cycles move in loose coordination, and the U.S. is lagging its peers, not leading. With the Fed increasingly isolated at the hawkish end of the spectrum, a policy reset may not just be prudent it may become inevitable.
Geopolitical Risk: Lessons from History
In geopolitics, the Israel-Iran narrative flared up again. Historically, crypto has shown resilience to these types of risk events. During past flare-ups: October 2024, Russia-Ukraine 2022, the COVID crash in 2020, initial panic was followed by fast recovery. This time has been no different: oil spiked briefly, but quickly mean-reverted, and crypto markets shrugged off the risk premium.
These episodes have become textbook: scary headlines trigger knee-jerk risk-off moves, only to fade within days or weeks. Fading geopolitical dislocations remains one of the most consistently profitable tactical trades in macro.
Below is a comparison of asset performance (Gold, BTC, S&P 500) following major geopolitical and macro shocks:

The takeaway: geopolitical shocks rarely derail long-term price trends unless they escalate into true systemic events. Most corrections have been fast, sentiment-driven, and ultimately reversed.
Crypto has evolved into a risk asset with high beta to liquidity, but its response to fear remains consistent sharp selloffs followed by aggressive rebounds.
Altcoins
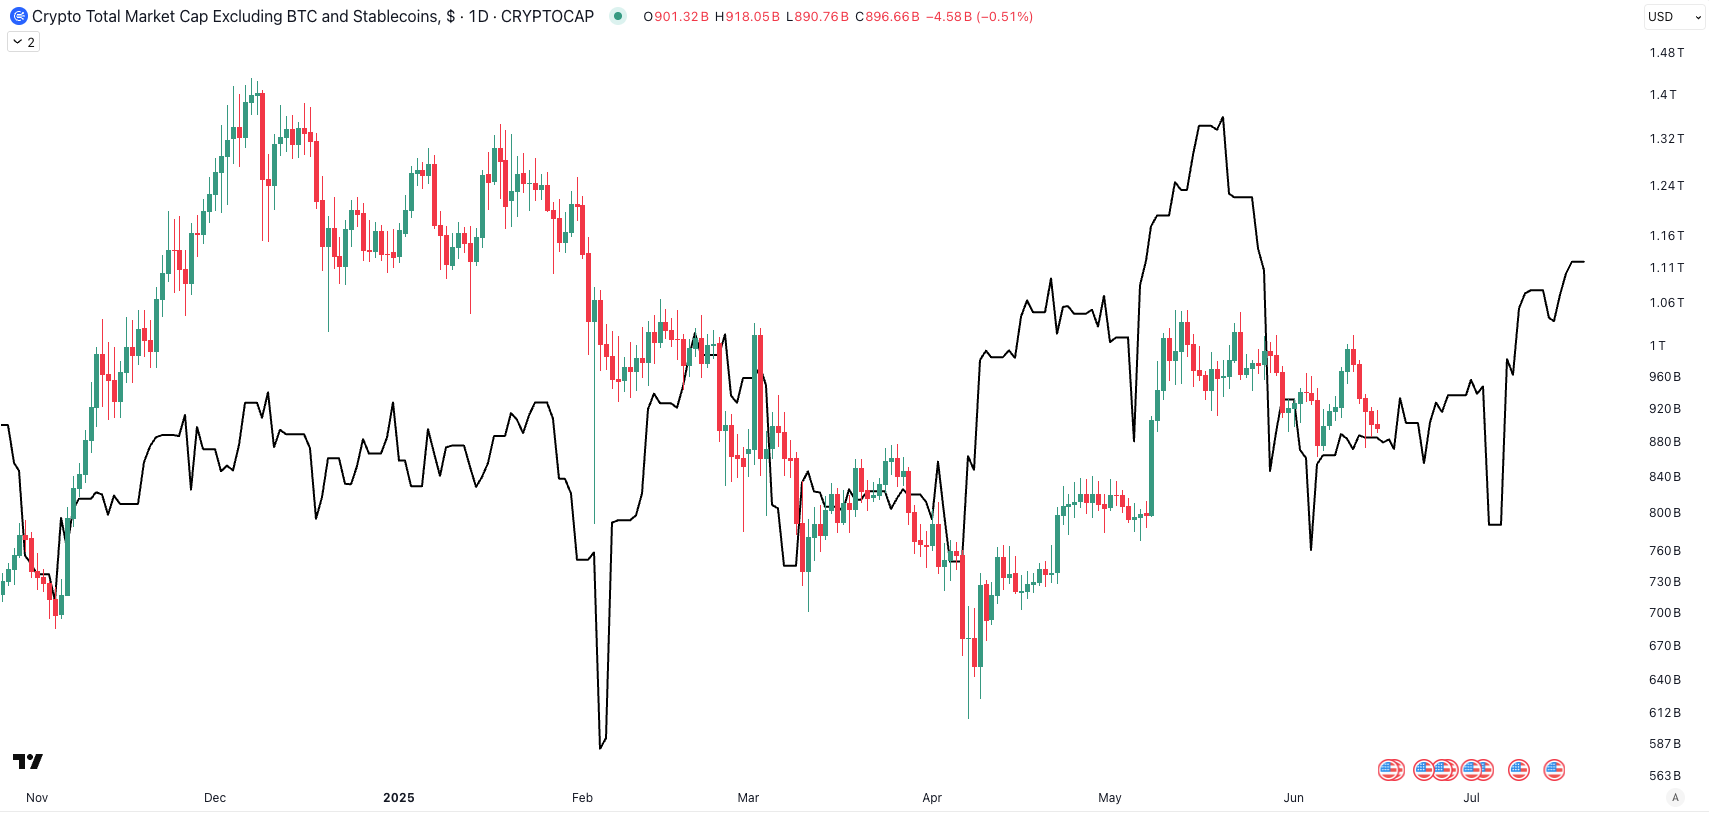
Altcoins remain range-bound, failing to convincingly break above the critical $1.2T–1.3T resistance zone on Total2, the total crypto market cap excluding BTC.

Despite recent rebounds, this zone has consistently acted as a ceiling since March, reinforcing the structural range we’ve seen since late 2021.
The most notable recent development: Total2 minus stablecoins is tracking net liquidity with a 35 day lag. This refined view strips out passive capital (i.e., stablecoins parked on the sidelines) and offers a clearer lens on how much real risk-taking is happening. Crypto’s speculative layer remains tightly coupled to Fed net liquidity.
But even as liquidity rises, new token issuance remains high, putting ongoing supply pressure on the market. As shown in the unlock forecast, May saw nearly $5.3B in unlocks, and June–August will each bring $8.9B more. This makes sustained breakouts difficult unless macro tailwinds overpower dilution.

Structural resistance, supply overhang, and liquidity sensitivity remain the key themes here. For altcoins to break out with conviction, either:
Net liquidity must accelerate meaningfully,
Or ETF-driven capital rotation must expand beyond BTC and ETH.
Until then, expect continued choppiness below major resistance, with short-term rallies fading unless backed by narrative or inflow catalysts.
Notably, even Ethereum has seen ETF momentum waver. After a record-breaking 19-day inflow streak, U.S.-listed spot ETH ETFs logged their first net outflow on June 13, shedding $2.2 million amid renewed geopolitical risk. ETH dropped ~8% as Israel-Iran tensions escalated, triggering over $1.1 billion in crypto liquidations.
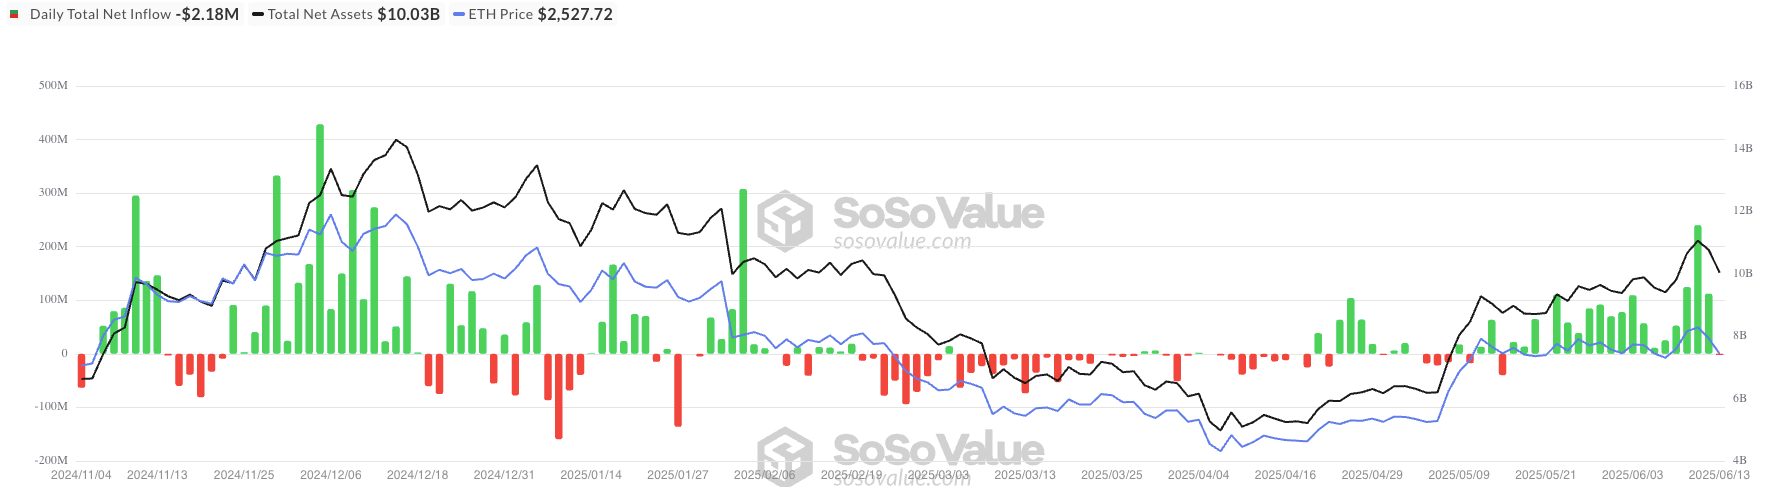
This contrasted sharply with BTC ETFs, which absorbed $302 million in net inflows on the same day, led by BlackRock’s IBIT and Fidelity’s FBTC. Still, the structural demand story for ETH ETFs remains intact: AUM stands above $10 billion, and the inflow streak marked the strongest run since launch.
More broadly, the ETF pipeline continues to expand. Last week, Fidelity filed for a Solana ETF, signaling institutional appetite is growing beyond ETH. In parallel, the SEC clarified that vanilla staking (delegation and validation) does not constitute a securities offering, effectively greenlighting the structure for “staking-inclusive” ETFs. This opens the door for ETH and SOL funds to offer native yield while remaining compliant.
Combined, these developments further support the thesis that capital will rotate down the risk curve in a staged manner. .
Cautious Optimism Amid Rotations
As Q2 winds down, the market sits at an inflection point. Bitcoin’s consolidation below resistance, easing inflation prints, and the early stirrings of ETF-driven altcoin rotation are setting the stage for potential summer re-acceleration, but nothing is confirmed yet.
The macro remains supportive but fragile: liquidity trends point upward, but issuance and geopolitical risk are adding noise. Risk assets are positioning for a dovish pivot, but the Fed has yet to blink. Meanwhile, crypto-specific flows are becoming more differentiated, favouring institutional-grade names and narratives with real-world traction.
For now, patience and selectivity remain key. Until BTC reclaims $108K on strength, and altcoin flows broaden materially, we expect chop to dominate. Positioning around strong narratives, ETH ETF expansion, and structurally scarce assets is likely to outperform passive beta.
Summer may be slow, but the foundation for later part of Q3 is being laid now.