


A blowout week in crypto, not just in price action, but in structure, flows, and breadth. Behind it all: liquidity. Macro continues to dictate risk, and this week made that abundantly clear.
Bitcoin climbed from $94K to $104K, slowly moving towards ATH, but was broadly outpaced across the risk spectrum. Ethereum rallied from $1,825 to $2,500, a +37% move and its strongest weekly gain since the last cycle’s blowoff top. ETH didn’t just break out, it reset positioning and reignited a rotation across majors and midcaps.
The total crypto market cap surged from $2.89T to $3.28T, adding $390B in value, the 5th strongest weekly gain since the start of 2023.

That strength wasn’t isolated. It was supported by rising stablecoin inflows, growing breadth, and clear evidence that capital is re-entering the system.
Global Liquidity in Focus
The rate cut narrative in the U.S. took a hit post FOMC meeting. Markets have gone from pricing a 55% chance of a Fed cut in June to now an 82.8% probability of no move at all. In any other cycle, that shift might have triggered a pullback. Instead, crypto rallied.
Why? Because liquidity and liquidity expectations, not rates is what matters here.
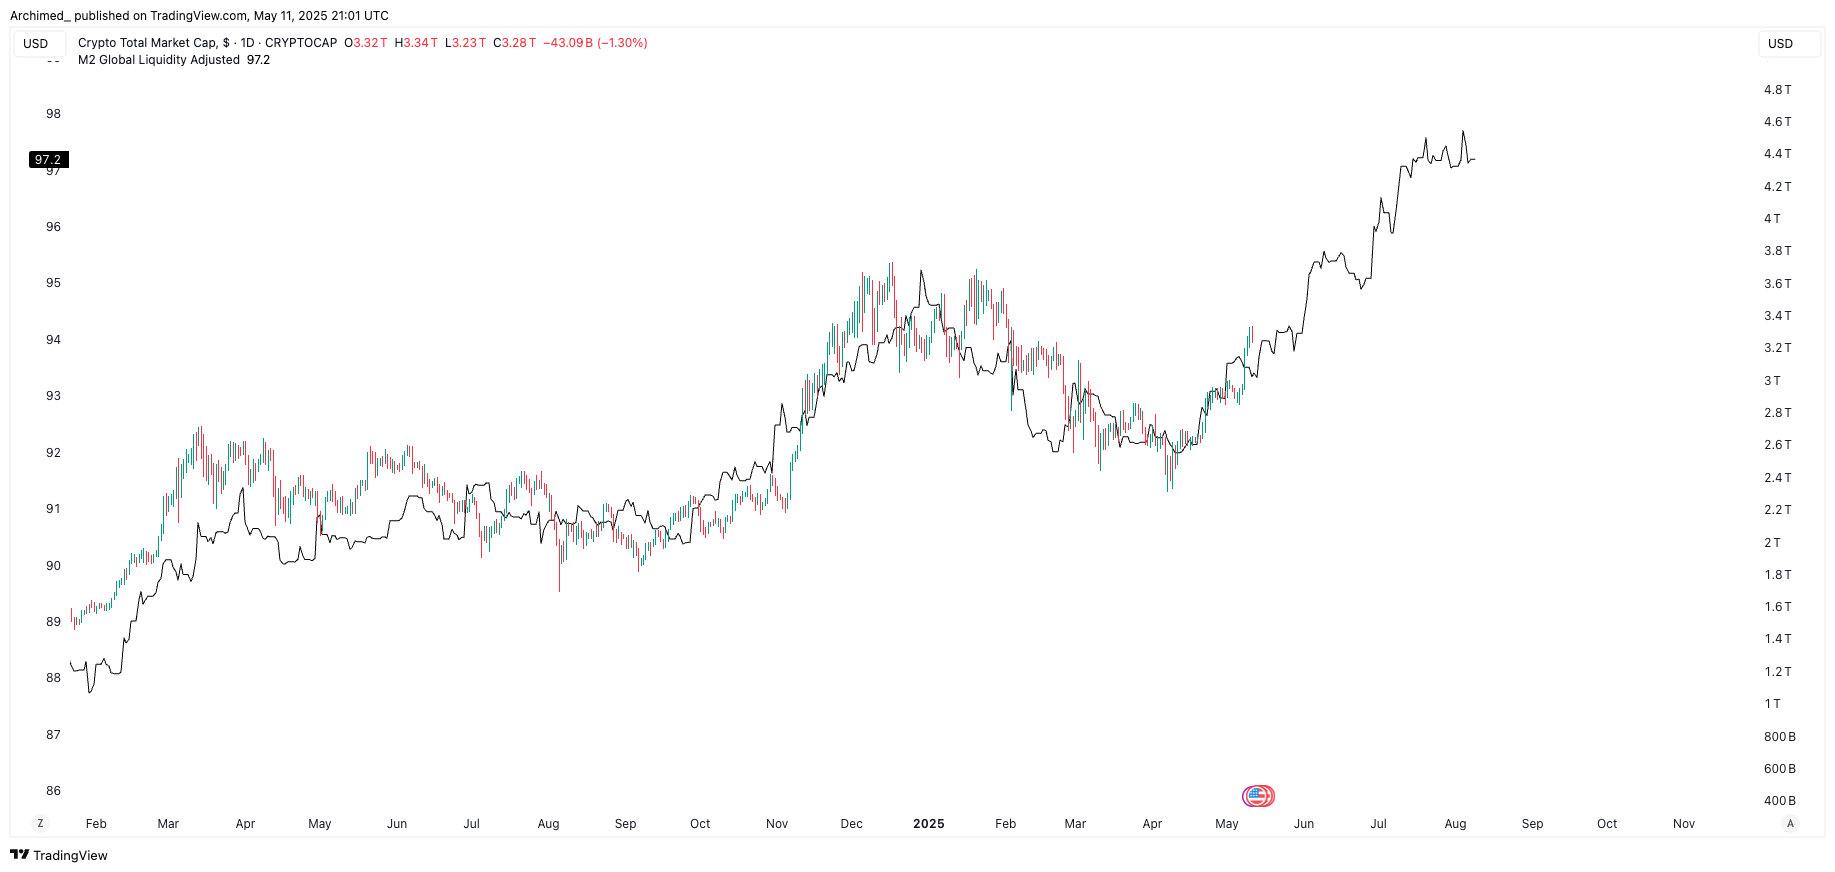
Global M2-adjusted liquidity continues to grind higher, and the crypto market is following it closely, with an observable ~90-day lag.
It’s not just the U.S. driving this. On May 8, China cut its key 7-day repo rate by 10bps to 1.40%, and next week, on May 15, the PBOC will cut its reserve requirement ratio (RRR) by 50bps, freeing up around ¥1 trillion (~$138B) in liquidity. These steps come just ahead of high-stakes trade talks with the U.S., and while politically motivated, the effect is economic: more capital, more cushion, more risk-on behaviour.
ETH Breaks Out, Altcoins Follow
Ethereum led the charge, jumping from $1,825 to $2,500 in its best week since 2021. It broke out against both USD and BTC, finally catching up after months of underperformance. Bitcoin also rallied, from $94K to $104K, but for once, it didn’t lead.

This was a market-wide move one of the first clean rotations down the risk curve in months. The strongest returns came from midcap assets, particularly in the $500M–$2B range. After spending most of 2025 under pressure, this cohort rebounded sharply.
More importantly, breadth is improving. Currently, 32% of the top 200 tokens have outperformed BTC over the last 90 days up from just 16% in March.

This is being driven by names ranked 50–100 by market cap, historically a key bracket during cycle expansions. The market is broadening, and capital is rotating.

YTD Picture Still Concentrated
Zooming out, though, things remain top-heavy. Only 3 tokens in the top 100 movers have outperformed BTC year-to-date

Mega caps (> $10B) remain the only market cap group with a net positive YTD performance.
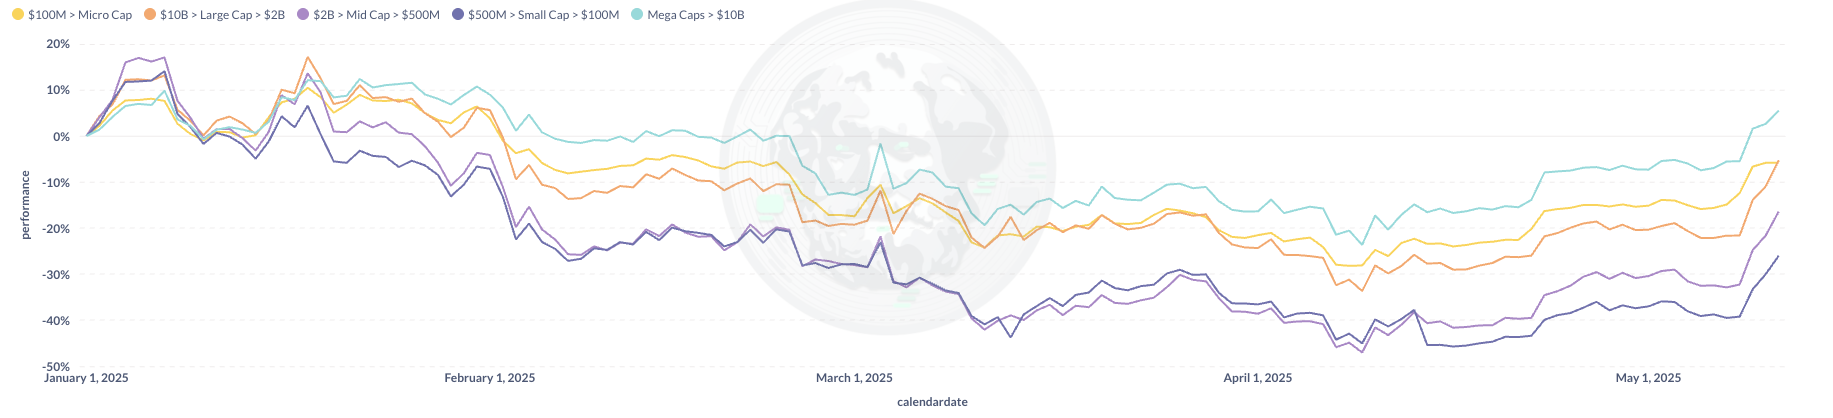
So while this week marks a shift, we’re still early. This is the beginning of participation expanding not the peak of it.
Onchain signals
Stablecoins
Stablecoins are once again confirming the reversal in crypto liquidity, this week, total supply hit a new all-time high of $220B, doubling from $110B in September 2023. That translates to a weekly compounded growth rate of 0.80%, or an annualised 51.33% over the past 87 weeks. It’s a steady, structural climb that continues to support broader market expansion.

More immediately, over $3B in net stablecoin inflows were recorded this week alone, with a 14-day average now running at ~$250M/day. These flows are historically one of the most reliable leading indicators of crypto-native capital returning and right now, they’re pointing decisively higher.

That momentum is starting to spill beyond DeFi and exchanges. This week:
Meta was reported to be in discussions around stablecoin deployment
Stripe launched “Stablecoin Financial Accounts”
Stablecoin transaction volume is now not just catching up to traditional rails, it's surpassing them. In 2024, stablecoin volumes overtook Visa’s global transaction volume for the first time, a milestone that underscores how critical these instruments have become to the digital economy.
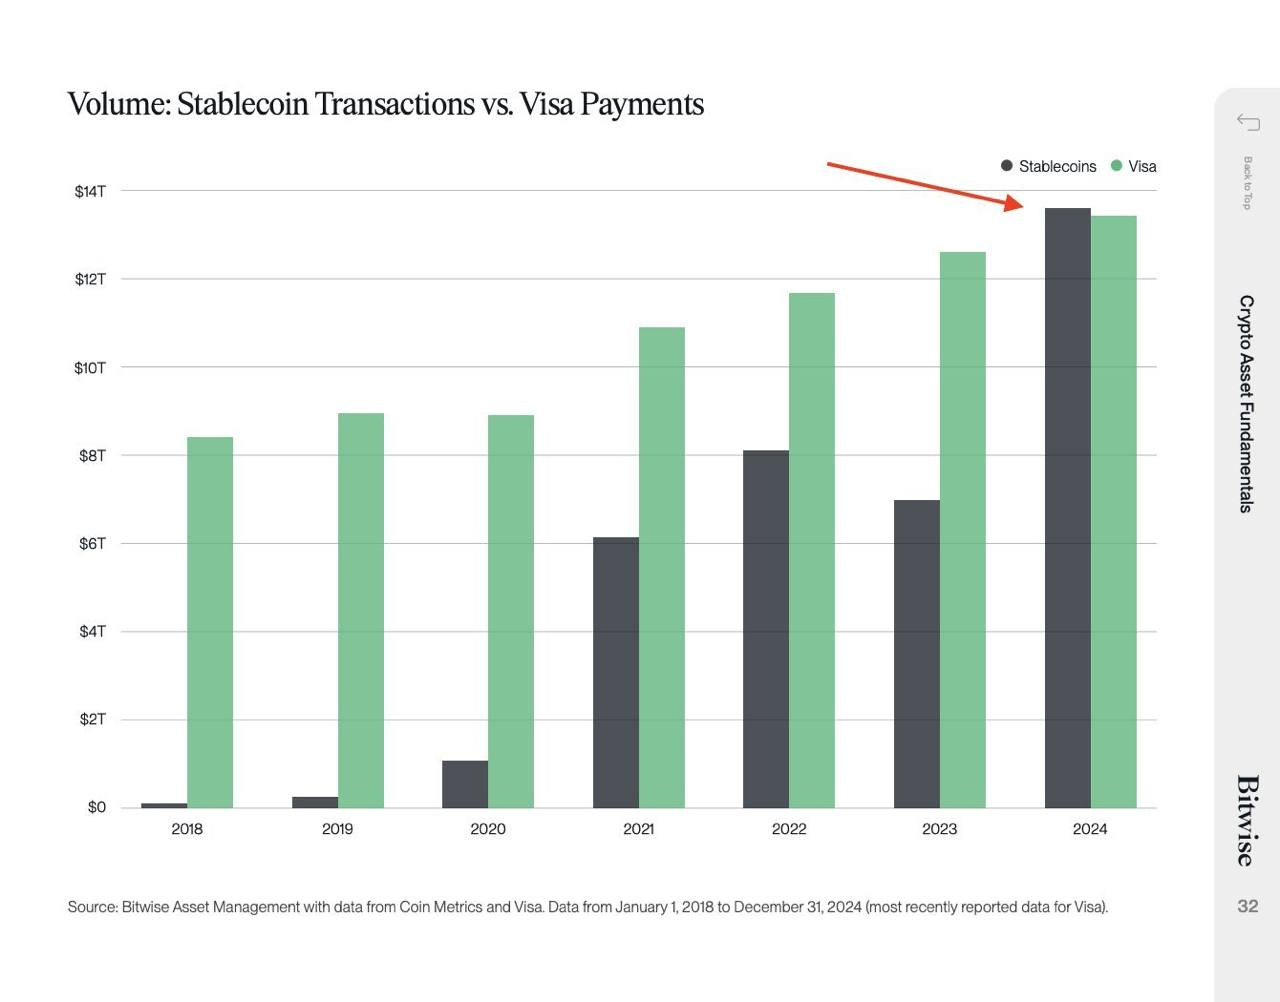
Stablecoin growth, particularly in USDT and USDC, has historically led market price action. That trend is holding. With new inflows, product launches, and institutional re-engagement.
DEX
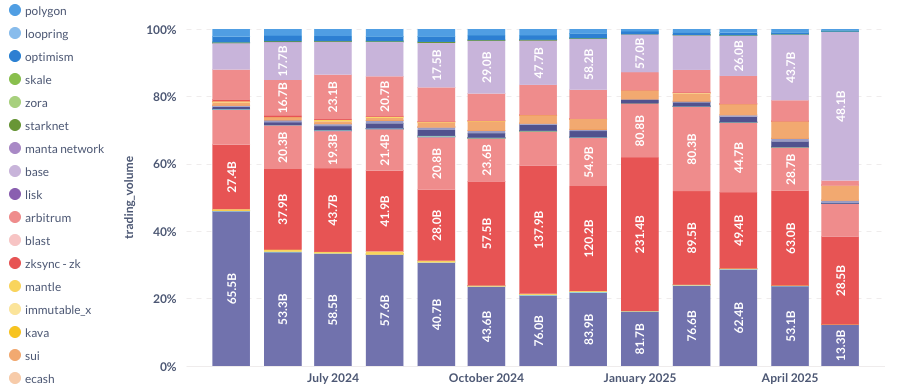
On-chain trading volumes picked up significantly. May is already on track to outperform April and March and to land in-line with Feb. With DEX to CEX ratio currently sitting at 16% for May.

Base continuing to gain market share across DEXs. It’s the most structurally healthy month of trading we’ve seen since early Q1.
Lending / Borrowing
Strong inflows confirm market re-risking. Lending markets just delivered one of their strongest stretches in recent memory.
The 14-day moving average of net inflows now sits at +$645M, capping a sustained multi-week move that reflects growing risk appetite and the return of active capital deployment. For context, this is the most consistently positive trend in lending flows since late 2023 and it comes alongside rising market cap, stablecoin expansion, and volume growth across DeFi.

Zooming in, daily flows over the past two weeks have been increasingly constructive. On May 9 alone, lending protocols saw a massive $5.2B in net inflows, with capital rotating into blue-chip money markets and newer cross-chain platforms such as Euler. That surge was followed by another $413M on May 10, keeping the 14-day trend firmly in positive territory.
The rebound in lending isn’t happening in isolation. As the chart shows, net lending flows have tracked the crypto total market cap closely, especially during inflection points.

This isn’t a hesitant re-entry it’s a full return of lending capital, signalling that participants are once again confident to borrow, lend, and pursue yield.
Strong Move, Rising Risks
This was one of the sharpest and broadest weekly rallies we’ve seen in over a year led by ETH, supported by midcaps, and confirmed by strong on-chain flows across stablecoins, lending, and DEX activity. Structurally, the market looks healthier than it has in months.
But while the momentum is undeniable, so is the risk of short-term overextension.
Historically, weeks like this, in the top 5% of all weekly gains, tend to see continued upside in the short term.

The average 1-week forward return after a strong week is +8.5%, and the median is +9.7%. However, by the second week, that momentum fades: 2-week forward returns drop to around +4.6% on average. In other words, sharp rallies often extend but also compress quickly.
This makes timing critical. We’re still missing a key tailwind: Fed liquidity, which markets are now pricing out. With no clear signal of easing ahead and tariff-related macro volatility building, the risk/reward over the next few weeks skews to the downside, even if the long-term structure remains compelling.
The setup is powerful but reflexive.