


At the start of 2025, we outlined twelve key predictions for crypto markets, grounded in macro signals, on-chain fundamentals, and emerging institutional trends. These weren't just high-conviction calls; they were frameworks for navigating what we believed could be a pivotal year for digital assets.
Six months in, it's time to revisit the scoreboard.
What’s working as expected? Where are we ahead of schedule or clearly off-mark? And which theses still have time to play out? This midyear update tracks each prediction against real-world outcomes using live market data, protocol analytics, and regulatory developments.
It’s part accountability, part insight and a key exercise in refining conviction.

Read the 2025 predictions here
I. Bitcoin's Path to $160k
Prediction (Jan 2025):
A peak MVRV Z-Score of 4.88x would imply a Bitcoin price of $160,000, driven by disciplined institutional flows and corporate treasury adoption.
H1 Reality Check:
Bitcoin reached a new all-time high of $111,970.17 on May 21st, propelled by persistent institutional demand via spot ETFs and a favourable macro backdrop. While ETF inflows have moderated from early-year peaks, they remain resilient, averaging $618M weekly year-to-date. Notably, the weeks of April 13 ($3B) and May 11 ($2.75B) saw exceptional surges, often following market pullbacks underscoring strong buy-the-dip behaviour among allocators.

The MVRV Z-Score currently sits at 2.38, well below overheated territory, indicating continued upside potential before reaching cycle extremes.
KPI Progress:
BTC Price: $111,970 vs $160,000 target
Weekly ETF Inflows: $618M avg (peaks at $3B)
MVRV Z-Score: 2.38x
Status: 🚧 In Progress
II. Stablecoins: The $400B Revolution
January Projection:
The stablecoin market was projected to approach $400B, driven by traditional financial institutions entering the space. Tether’s 71% dominance was expected to decline below 50%.
H1 Reality Check:
As of mid-2025, the stablecoin market stands at just under $250B, advancing but still short of our $400B target. Tether’s share has declined from 67.8% in December 2024 to 63.4%, marking a notable shift. YTD inflows tell a similar story: Tether (+$21B) and USDC (+$15B) remain top performers.
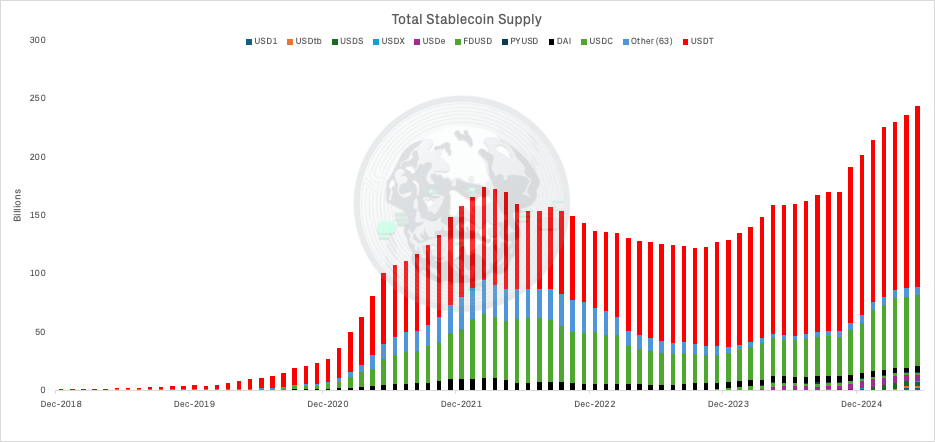
Yield-bearing alternatives have gained momentum, BUIDL climbed from $500M to $2.9B in just six months. Regulatory headwinds are easing too: the Senate passed the GENIUS Act, and the bill now awaits House approval and presidential signature, charting a compliant path for regulated, one-to-one backed stablecoins.
Meanwhile, we’re witnessing tangible movement toward bank-issued stablecoins. JPMorgan Chase is piloting a USD deposit token (JPMD) on Coinbase’s Base L2 blockchain, fully backed by commercial bank deposits, permissioned for institutional clients, with interest-bearing potential and eligibility for deposit insurance. Other banks, including Bank of America, Citi, and Wells Fargo, are reportedly exploring their own digital-dollar initiative
KPI Progress:
Stablecoin Market Cap: $250B vs $400B target
Tether Market Share: 63.4% (down from 67.8%)
Yield‑Bearing Tokens (BUIDL): $2.9B (from $0.5B)
USDC Inflows: $15B YTD
Bank‑Issued Stablecoin Pilots: JPMD live on Base; other major banks exploring similar solutions
Regulatory Milestone: GENIUS Act passed Senate, pending House and presidential approval
Status: 🚧 In Progress
III. Ethereum’s New Heights
January Projection:
Ethereum was forecast to surpass $7,000, bolstered by:
Institutional staking demand locking up over 50% of ETH (~$150B) in the consensus layer, reshaping tokenomics.
Expansion of regulated staking products, including ETH staking ETFs offering yield + price exposure.
Regulatory clarity, classifying staking rewards as qualified income, removing a major institutional barrier.
Major custodians (BlackRock, Fidelity) launching staking services, while liquid staking protocols serve retail demand.
H1 Reality Check:
Ethereum has seen robust institutional adoption, though the price remains well below target so far. Over 35 million ETH (~29.3% of total supply) is now staked, up 0.85pp YTD, confirming strong protocol-level demand

However, price action has lagged, underperforming Bitcoin. ETH currently trades at $2450, down 25% YTD, well below our $7K expectation. However we expect H2 to be more exciting with staked ETF being a positive trigger.
Regulatory momentum is encouraging: the SEC has no more comments pending on staked ETH ETFs from REX and Osprey, clearing the path for potential U.S.-listed staking-inclusive products BlackRock and Fidelity are both pushing forward with staking-enabled ETF proposals, with industry projections suggesting approval could arrive in H2 2025
KPI Progress:
ETH Price: ~$2450 vs $7,000 target
Staking Participation: ~29.3% of supply (35M ETH) vs >50% target
Staking ETFs: REX/Osprey filings cleared; BlackRock/Fidelity on course
Status: 🚧 In Progress
IV. The ETF Explosion
January Projection:
We anticipated a full-on ETF boom:
$200B in total BTC ETF AUM,
Daily ETF volumes consistently over $2.5B,
Launch of ETH staking and SOL ETFs, followed by diversified baskets.
H1 Reality Check:
Crypto ETFs have surged ahead of expectations in key metrics:
BTC ETF AUM now stands at $142.4B and ETH ETF AUM at $10.7B
Daily ETF volumes hit $2.82B around late June , aligning with and even exceeding our $2.5B expectation.
There’s strong momentum building in the Solana ETF arena: REX Shares’ Solana staking ETF has resolved SEC comments and looks poised for imminent launch while eight issuers (including 21Shares and CoinShares) have filed for spot SOL ETFs with Bloomberg assigning ~90% probability of approval before year-end.
Across the board, applications for XRP, LTC, DOGE, ADA, AVAX and other ETFs are proliferating, and analysts estimate a 95% chance of approval by 2025-end . The market is witnessing a “crypto ETF summer,” fueled by regulatory openness
KPI Progress:
BTC ETF AUM: $142.4B vs $200B target
ETH ETF AUM: $10.7B
Daily ETF Volume (BTC + ETH): $2.8B+
Solana ETF Launch: Imminent (REX), others in filing stage
Other Altcoin ETF Filings: Multiple (XRP, LTC, DOGE, ADA, AVAX); near certainty of approval
Status: ✅ On Track
V. ETH/BTC’s Critical 0.05 Break
January Projection:
We projected a break above 0.06 in the ETH/BTC ratio, signaling rising institutional conviction in Ethereum’s value proposition, especially amid ETF adoption and staking growth.
H1 Reality Check:
ETH/BTC has broken down sharply, invalidating our bullish thesis for this ratio at least for now. As of late June, the pair trades near 0.0227, marking its lowest levels since early 2021. The ratio has not only failed to break above 0.05, it has decisively lost multi-year support and continues trending within a persistent downward channel since mid-2022.

Despite ETH ETF inflows and growing staking participation, market leadership has remained concentrated in Bitcoin. BTC's institutional narrative, macro hedge status, and dominant ETF flows have widened the performance gap.
This ratio breakdown reflects deeper market preferences: the flight to perceived quality, liquidity, and simplicity in ETF-driven allocation cycles. Ethereum’s underperformance may yet reverse but structurally, Bitcoin has recaptured dominance in the eyes of capital allocators.
KPI Progress:
ETH/BTC Ratio: 0.0227 (vs >0.06 target)
Trend: Decisive breakdown below 0.05, multi-year support lost
Status: ❌ Missed
VI. DEX / CEX Ratio Hits 20% at Peak
January Projection:
We forecasted the DEX-to-CEX trading volume ratio would reach 20% at its mid-year peak, supported by institutional DeFi growth, reduced execution costs, and maturing infrastructure.
H1 Reality Check:
The DEX/CEX ratio has surpassed expectations, peaking at 27.8% in June 2025. This marks a dramatic rise from the December 2024 level of 13%, with structural and cyclical catalysts driving the shift.
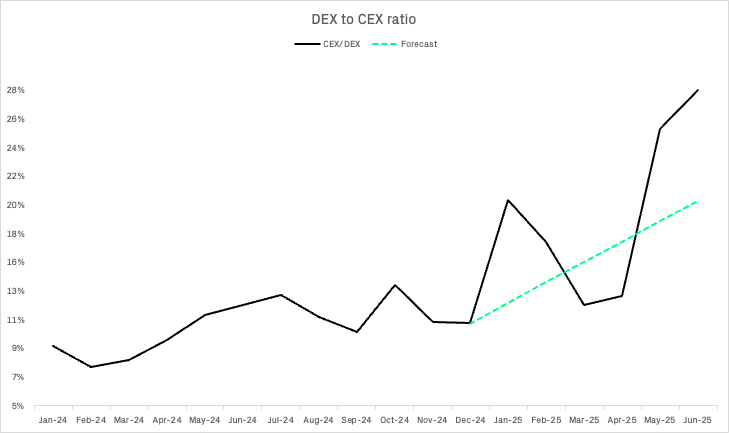
After moderate growth through Q1, volumes surged in Q2. The ratio exceeded even our optimistic forecast trajectory, indicating a clear rotation toward decentralised venues. Winners are: Raydium, Pancakeswap, Uniswap, Pump.fun & Aerodrome
KPI Progress:
DEX/CEX Volume Ratio (Peak): 27.8% (vs 20% target)
Ratio in Dec 2024: 13%
Top Contributors: Raydium, Pancakeswap, Uniswap, Pump.fun & Aerodrome
Status: ✅ Done
VII. Alt Season Returns
January Projection:
We forecasted a retracement in BTC dominance to 40–42%, with the OTHERS/BTC ratio rising toward 0.30, signalling a broad altcoin rotation driven by sector fundamentals and capital redeployment.
H1 Reality Check:
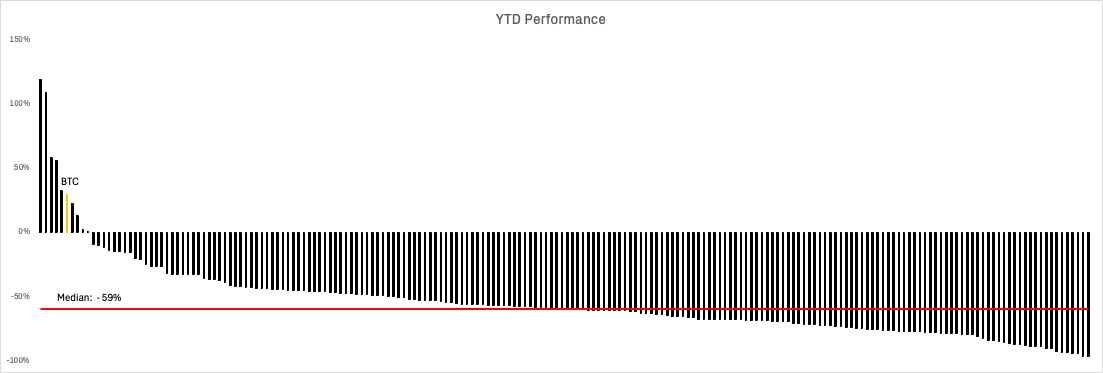
The anticipated alt season has not materialized. On the contrary, Bitcoin dominance has surged to 65.54%, its highest level since 2021. This reflects a sustained preference for BTC as the primary asset among institutional allocators—particularly via ETF inflows and macro hedge positioning.

The OTHERS/BTC ratio sits at 0.11, a multi-year low, now hovering just above structural support. This indicates that altcoins as a group have continued to lose ground relative to Bitcoin, despite pockets of strong individual performance.

In our trackable universe, only a handful of names have outperformed BTC on a YTD basis. Notably, one of our high-conviction positions, Euler, has delivered material outperformance, validating the strategy of selective altcoin exposure over passive diversification. However, this alpha remains scarce and fragmented.
KPI Progress:
BTC Dominance: 65.54% (vs 40–42% target)
OTHERS/BTC Ratio: 0.11 (vs 0.30 target)
Sector Strength: Isolated (AI, DePIN, Move-based L1s)
Status: ❌ Missed
VIII. DeFi’s $400B Milestone
January Projection:
We projected DeFi TVL to reach $400B by year-end, underpinned by institutional capital inflows and improved value capture across lending, staking, and derivatives protocols.
H1 Reality Check:
As of June 26, 2025, total DeFi TVL sits at $189.7B, tracking below target but still showing structural resilience. Growth has been uneven across verticals, with Lending ($84.18B) and Liquid Staking ($47.12B) leading, while DEXs ($19.42B) and Derivatives ($5.66B) remain far from their projected compounding trajectory.
The slower-than-expected expansion reflects persistent fee compression, volatility-driven outflows in Q1, and regulatory hesitancy around certain DeFi primitives. Still, long-term fundamentals remain intact, especially in verticals with clear institutional product-market fit like overcollateralized lending and staking services.
KPI Progress:
Total DeFi TVL: $189.7B (vs $400B target)
Growing Sector: Lending TVL at $84.2B (+11% YTD)
Status: 🚧 In Progress
IX. Lending Market Evolution
January Projection:
We projected that outstanding DeFi loans would reach $60B by year-end, supported by the expansion of overcollateralised lending markets and adoption by institutions via protocols like Aave, Morpho, Euler, and Maple. We anticipated continued reliance on healthy 125–200% collateralisation ratios.
H1 Reality Check:
As of 30 June 2025, outstanding loans total $31.43B, up from $27.55B on December 31, a 14.1% increase YTD. This keeps the lending sector on track to potentially meet the full-year $60B projection. Lending TVL (excluding borrowed funds) has also risen to $53.58B, indicating increased protocol engagement.
Yet, capital utilisation has diverged meaningfully across protocols:

Utilisation = Borrowed ÷ Supplied TVL (including borrowed funds)
While Euler has materially increased its utilisation, rising from 42.8% to 51.1%—other major protocols have experienced mild to moderate declines. Aave and Morpho grew in absolute borrow terms, but saw inflows of idle capital outpace borrowing demand. Maple, despite strong growth in loan issuance, has seen utilisation fall due to an aggressive expansion of available credit capacity.
KPI Progress:
Outstanding Loans: $31.43B (vs $60B full-year target)
YTD Borrowing Growth: +$3.88B (+14.1%)
Utilization Efficiency:
Euler: ↑ from 42.8% → 51.1%
Aave: ↓ from 41.5% → 40.2%
Morpho: ↓ from 37.9% → 35.6%
Maple: ↓ from 41.9% → 35.9%
Status: 🚧 In Progress
X. SVM and MOVE Gain Ground
January Projection:
We anticipated SVM (Solana) would reach 45% of DEX trading share, and MOVE VM ecosystems (Aptos, Sui, Sei) would collectively hit 10%, supported by growing developer momentum, novel execution frameworks, and early institutional interest. Monthly volumes were expected to approach $500B, riding the wave of faster, modular blockchains.
H1 Reality Check:

Framework competition intensified in H1, but the results reflect both technological gains and ecosystem fragility:
Solana (SVM) began the year with exceptional momentum, peaking above 60% of DEX share in early January due to the launch of Trump coin. However, that dominance was short-lived, and as liquidity rotated back toward EVM, Solana settled around 30–40% by mid-June.
MOVE VM chains briefly showed signs of acceleration, reaching a peak of 6.44% market share in April driven primarily by activity on Sui-based DEXs like Cetus. However, this growth was abruptly curtailed following the Cetus exploit, which significantly damaged user trust and halted capital flows into the MOVE ecosystem. Post-hack, MOVE VM’s share declined steadily, reverting to 2–3% by mid-June.
EVM frameworks have staged a strong comeback, capturing 50–55% of DEX volumes driven by strong adoption on Base, while BNB has quietly surged to hold ~30% share, the strongest outside the EVM cohort.

Despite volatility in framework dominance, aggregate volumes surpassed expectations, crossing the projected $500B/month threshold again in June,
KPI Progress:
SVM Share: ~35% (vs 45% target)
MOVE VM Share: Peak 6.4%, now ~3% (vs 10% target)
Monthly DEX Volume: Exceeded $500B in January & June
Status: 🚧 Mixed Progress
Signals, Surprises & Second-Half Setups
The first half of 2025 delivered a dynamic, but uneven crypto market. While headline metrics like Bitcoin’s new all-time high and $600B+ monthly DEX volumes reinforce structural strength, performance across categories varied:
Institutional flows remain the core driver, powering BTC and ETF-linked assets while lifting credible DeFi verticals like lending and staking.
Ethereum’s underperformance both in price and ETH/BTC stands out as a key miss, but pending ETF catalysts could shift the narrative in H2.
Altcoin season has yet to arrive in aggregate, but selective alpha rewarded focused exposure.
Framework competition is heating up: SVM made a strong showing, MOVE VM showed promise pre-Cetus, and EVM reclaimed share via Base and Arbitrum.
Importantly, the regulatory overhang is clearing. The GENIUS Act, ETF approvals, and pilot bank-issued stablecoins suggest a more permissive environment taking shape especially in the U.S.
As we look ahead, our framework remains: track fundamentals, size conviction, and let data lead. The back half of 2025 still offers room for surprises and plenty of upside.