


In last weeks, The Insider, we argued that BTC needed a daily and weekly close above $78,000 to confirm acceptance above the range, and that $80,000 was the next trigger which could then open a move into the mid-$80,000s. That was the core roadmap we laid out, alongside the broader view that crypto was still trading as a macro and equity-sensitive risk asset rather than in a fully self-propelled crypto regime.
This week largely validated that framing. By the weekend, BTC was trading around $81.4k and ETH around $2.3k, while IGV finished near $91.15, S&P500 near $7398 and Nasdaq above 29,200. Both the S&P 500 and Nasdaq notched fresh record highs during the week as AI-linked stocks and strong earnings kept the broader US risk complex well bid.
The move was constructive, but it still did not look like a clean, endogenous crypto breakout. It looked much more like BTC continuing to act as the cleanest liquid proxy for improving macro sentiment, rich US equity leadership and easing near-term stress around oil. That was bullish while equities remained in gear, but it also meant crypto had not detached from the macro tape.
Crypto
From a pure market-structure perspective, BTC did the important thing. It took out $80,000 early in the week, briefly slipped back below, and then stabilised back above it. A level last seen since late January and by Sunday still closing above it. That kept the mid-$80,000s as the next obvious upside pocket rather than a distant scenario
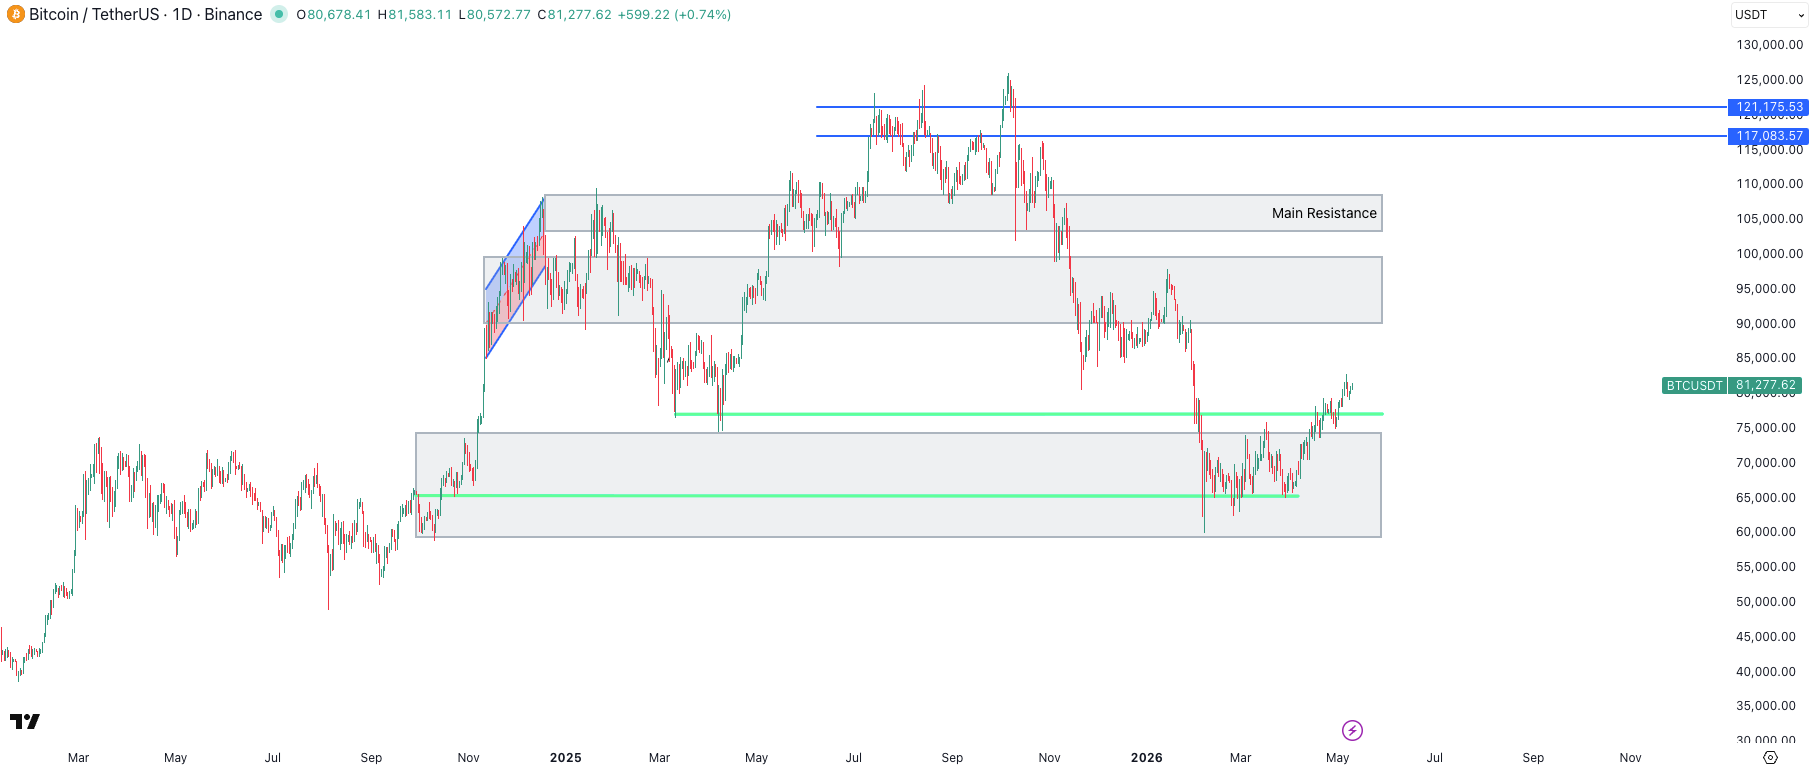
That mattered even more because it lined up almost perfectly with the framework from last week. We had argued that above $78,000 was constructive and above $80,000 was momentum. This week delivered both. The clean takeaway was that BTC had improved its short-term structure, but it had not yet earned immunity from a broader risk wobble. The breakout looked real enough to respect, though still conditional enough not to chase blindly.
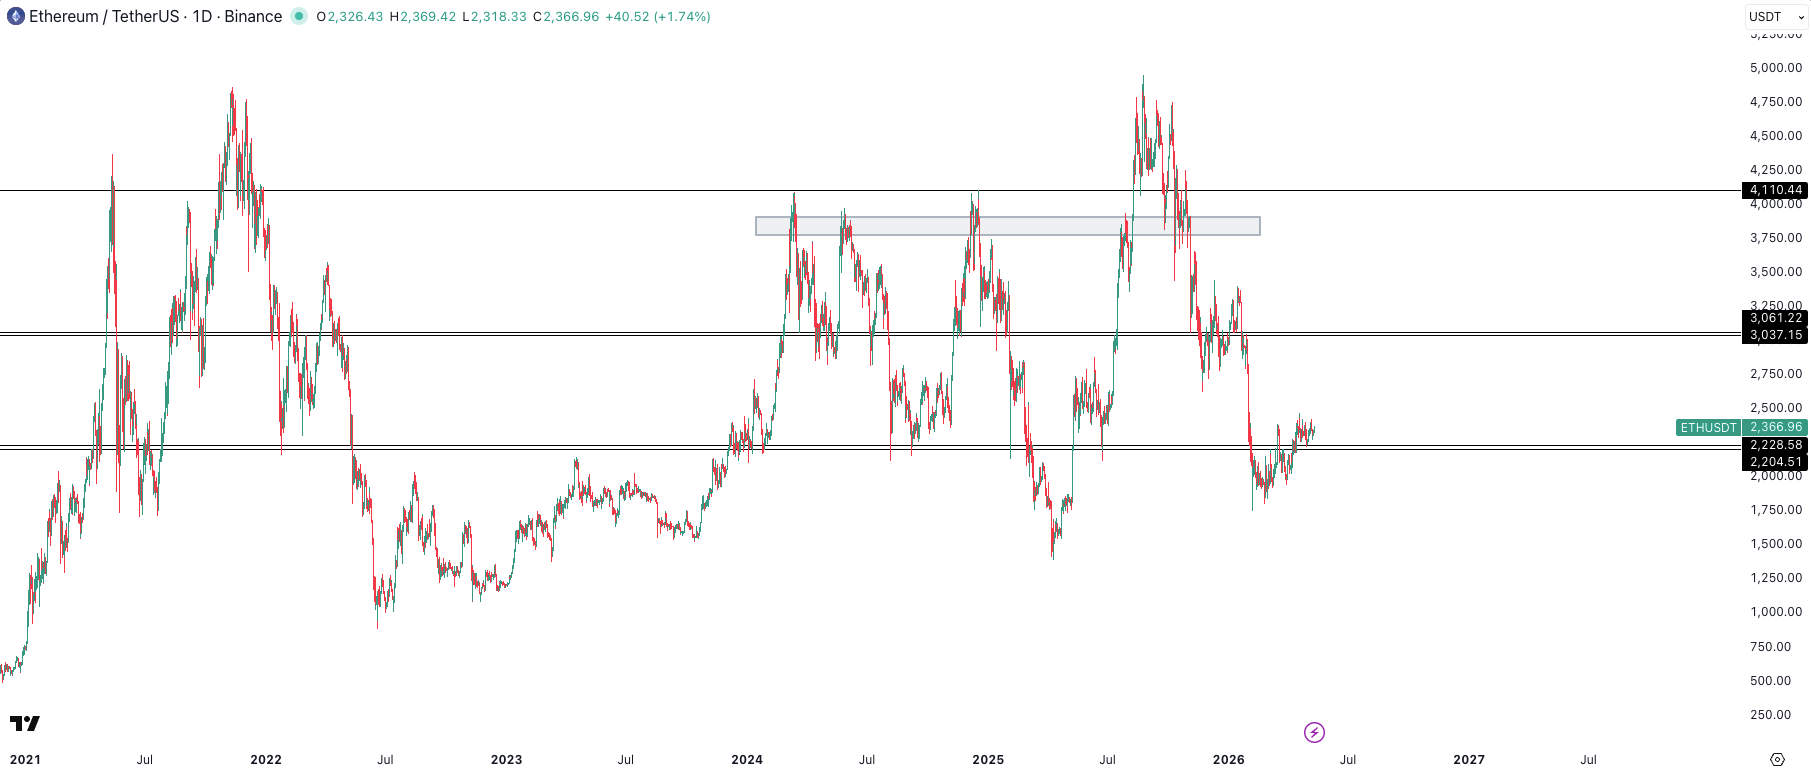
ETH, by contrast, still did not behave like leadership. It did the necessary thing by holding the shelf we had highlighted last week around the low-$2,000s and it traded near $2.36k by the weekend, but it remained well below the $3,000-plus zone that would have made the chart look genuinely convincing again. That left ETH in the same role as before: alive, stabilising, but still following rather than leading.
Under the surface, the tape was more interesting than the headline BTC move alone. In our basket work, the 50-100 cap cohort outperformed the overall market, Solana remained one of the cleaner beta leaders, and the ex-top-10 complex also participated.
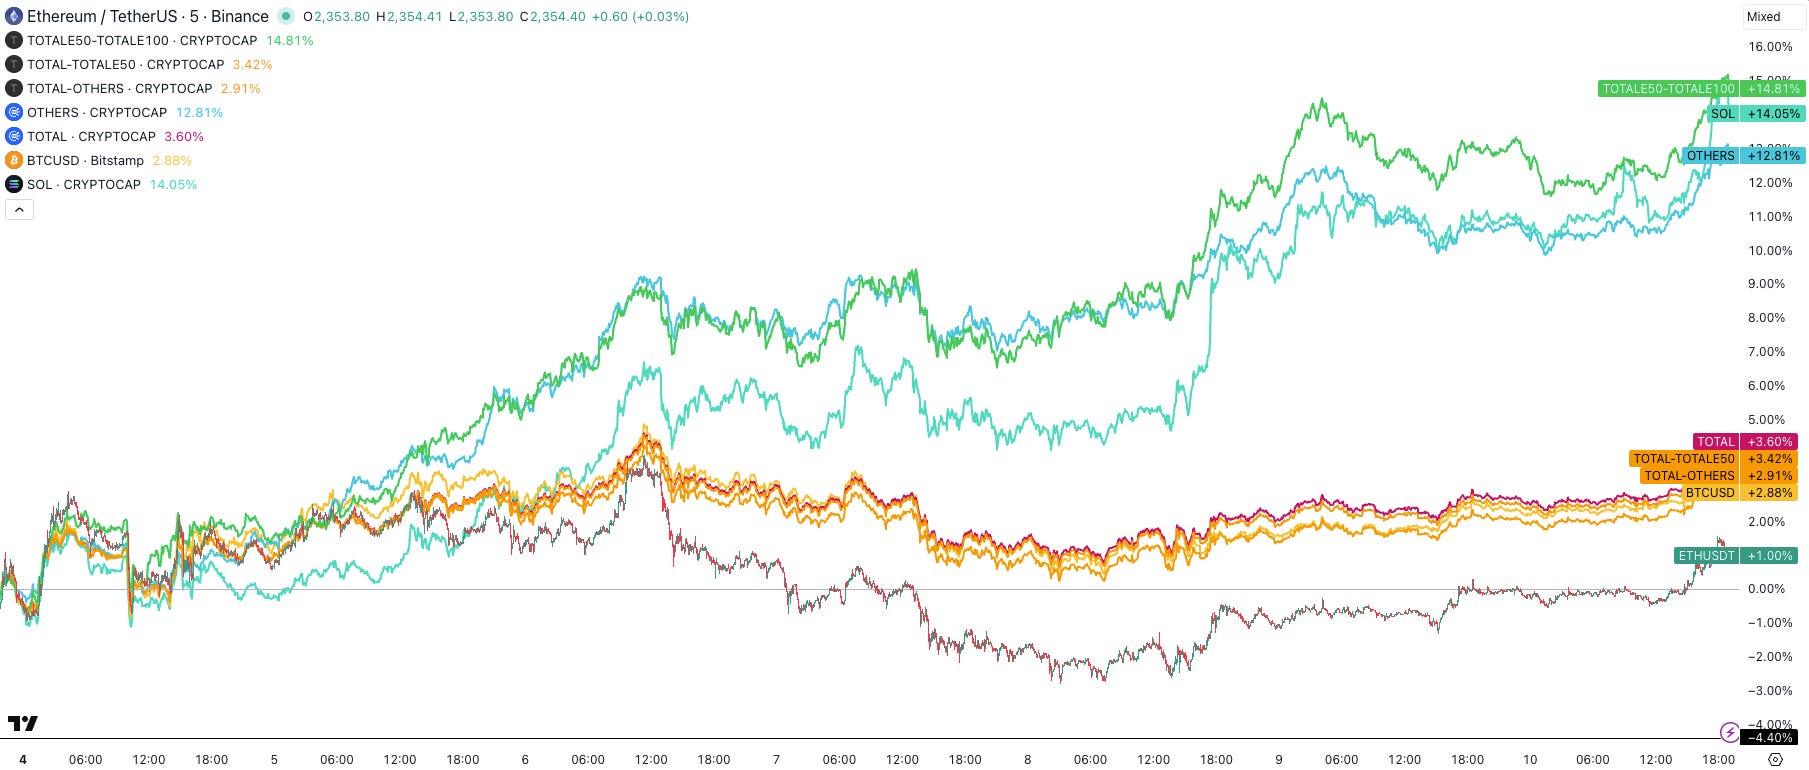
At the same time, the broad top-50 basket and ETH lagged. That was actually a constructive mix. It suggested the rally broadened selectively into higher-beta pockets, but it still stopped short of the kind of indiscriminate alt frenzy that usually marks a late, frothy phase.
Cross-asset leadership and sentiment
The clearest tell remained outside crypto. US equities spent the week pressing higher, helped by a still-strong earnings tape and ongoing AI enthusiasm. S&P 500 Q1 profit growth was on track for the strongest pace since late 2021, while AI-linked names kept extending leadership. AMD alone jumped 14.9% after its forecast, the Philadelphia Semiconductor Index hit another record, and Google Cloud revenue surged 63% while investors punished Meta for pushing capex higher without providing the same clarity on monetisation.
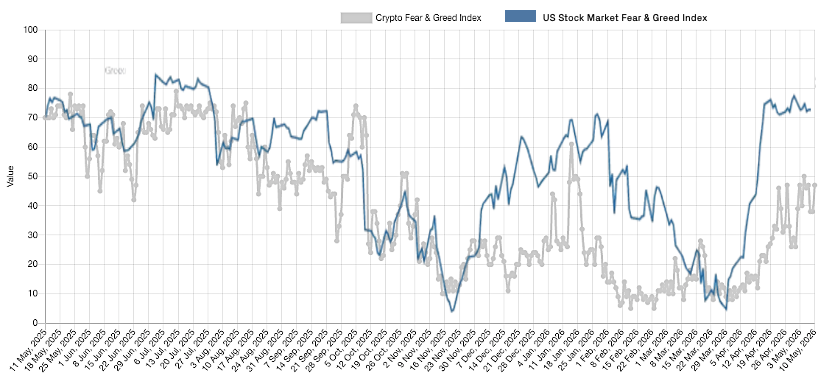
Sentiment reflected that divergence. US Equity sentiment trackers fear-and-greed gauge sat around 67, firmly in “greed”.
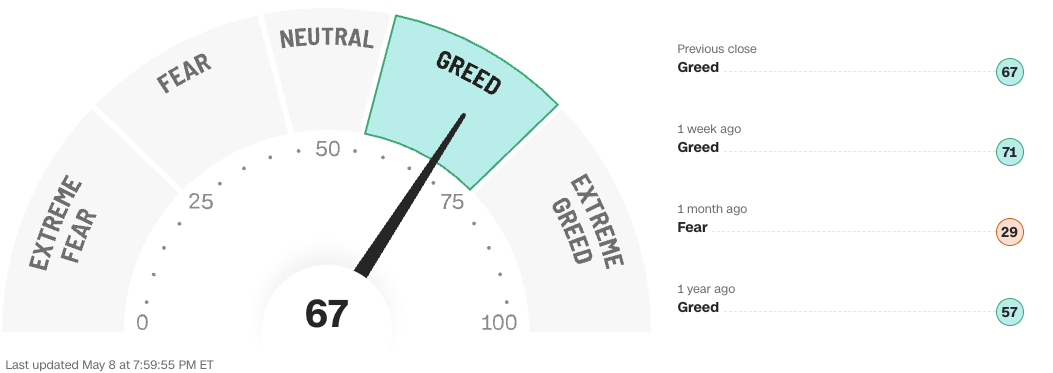
while Crypto fear-and-greed index was only 52, which is merely “neutral”.
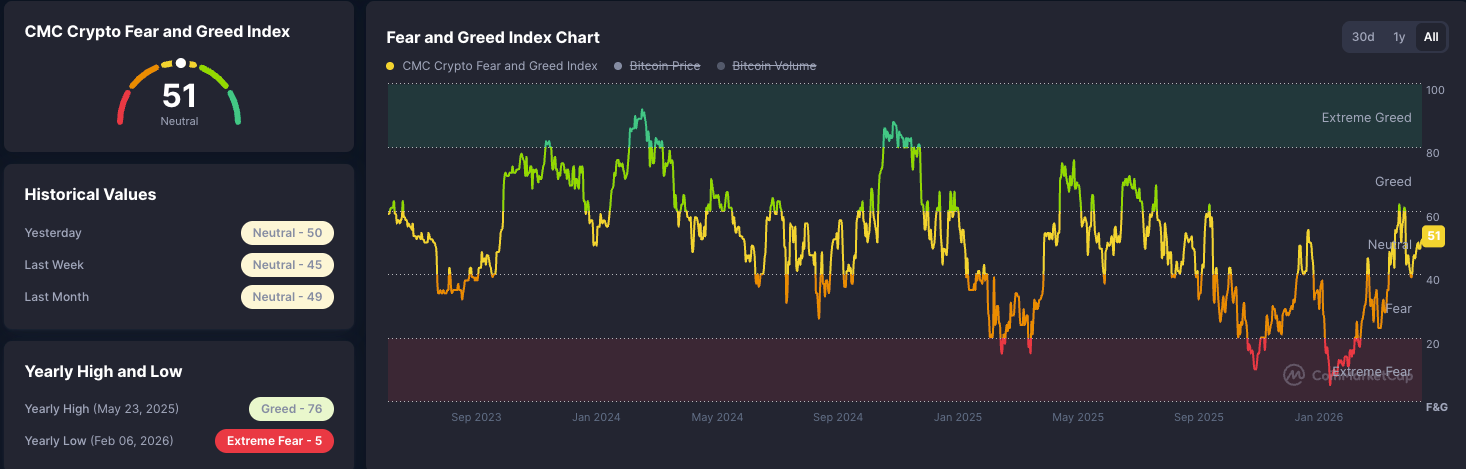
That gap is important. It indicates that the US stock market had moved much closer to enthusiasm than crypto had, even though BTC was rallying. Put differently, crypto benefited from the same cross-asset tailwind, but it still was not the primary source of the impulse.
Last week’s we flagged that BTC’s relationship with software (IGV) and equities was tightening again. This week, shows that re-coupling persisting, with IGV continuing to recover alongside BTC.
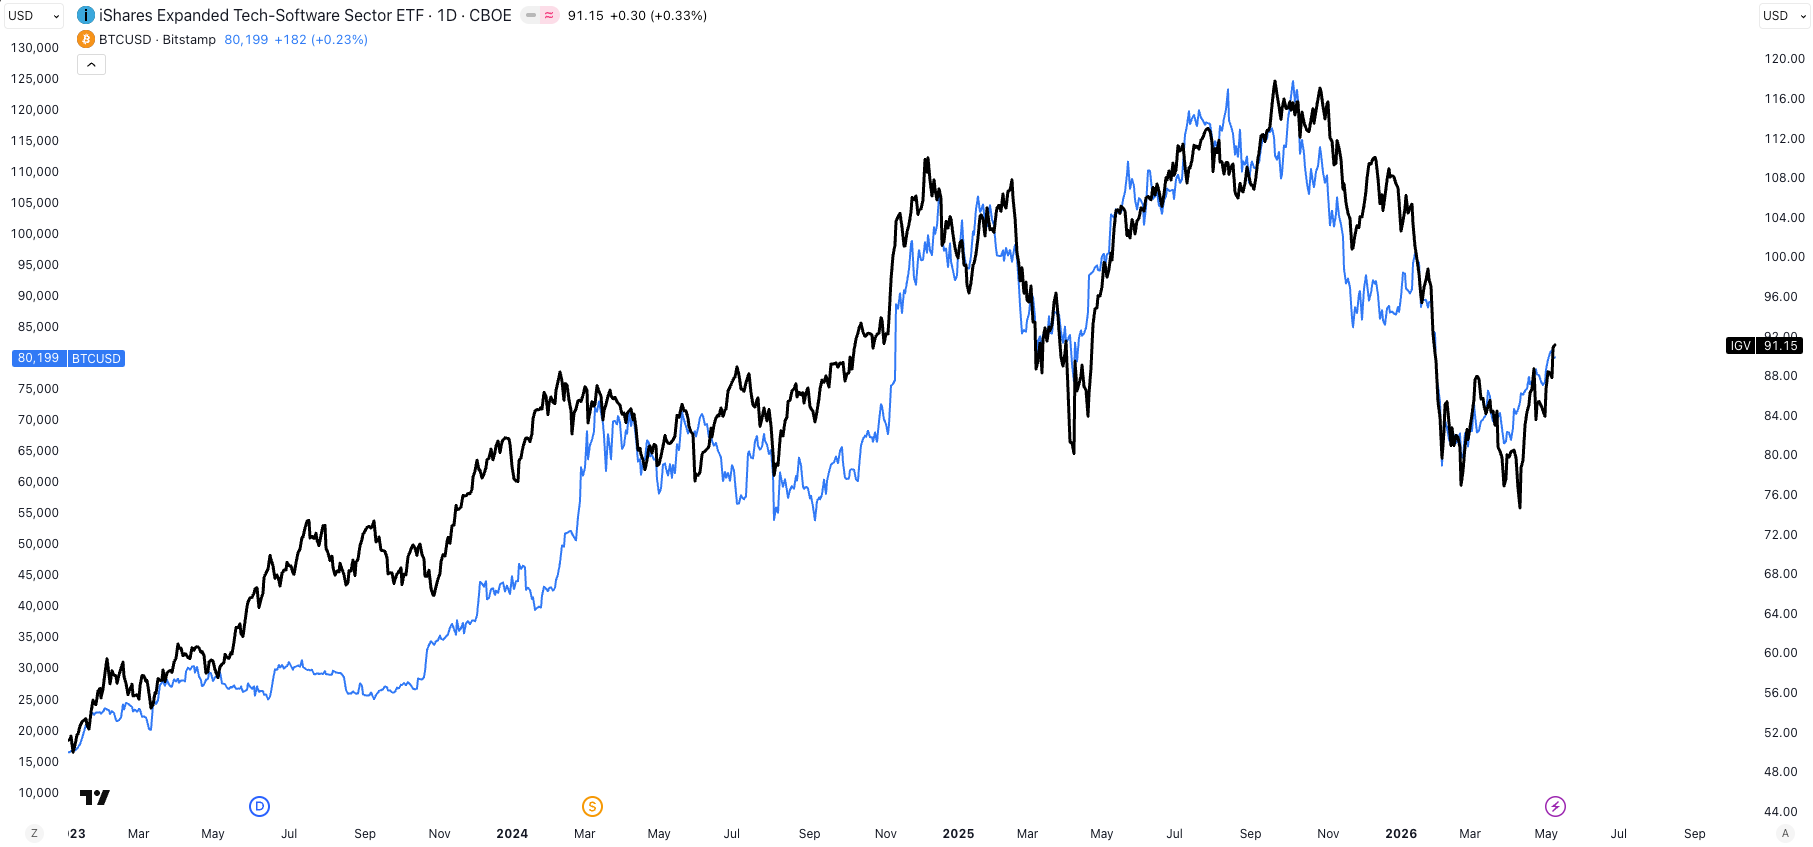
The practical conclusion stayed the same: BTC was leading crypto, but crypto was not leading macro. As long as the US growth-and-AI complex remained the market’s preferred expression of risk, BTC could keep grinding higher. If that equity leadership cracked, BTC still looked more likely to follow than to resist.
Technically, that left an important asymmetry. BTC’s 14-day RSI had risen into the mid-60s and its major long-term averages were clustered in the low-$80,000s, which suggested improving momentum without outright exhaustion. The Nasdaq looked different. RSI above 82, an unusually streched reading, which in prior instances had been followed by meaningful corrections of 15-20% usually within 30 days.
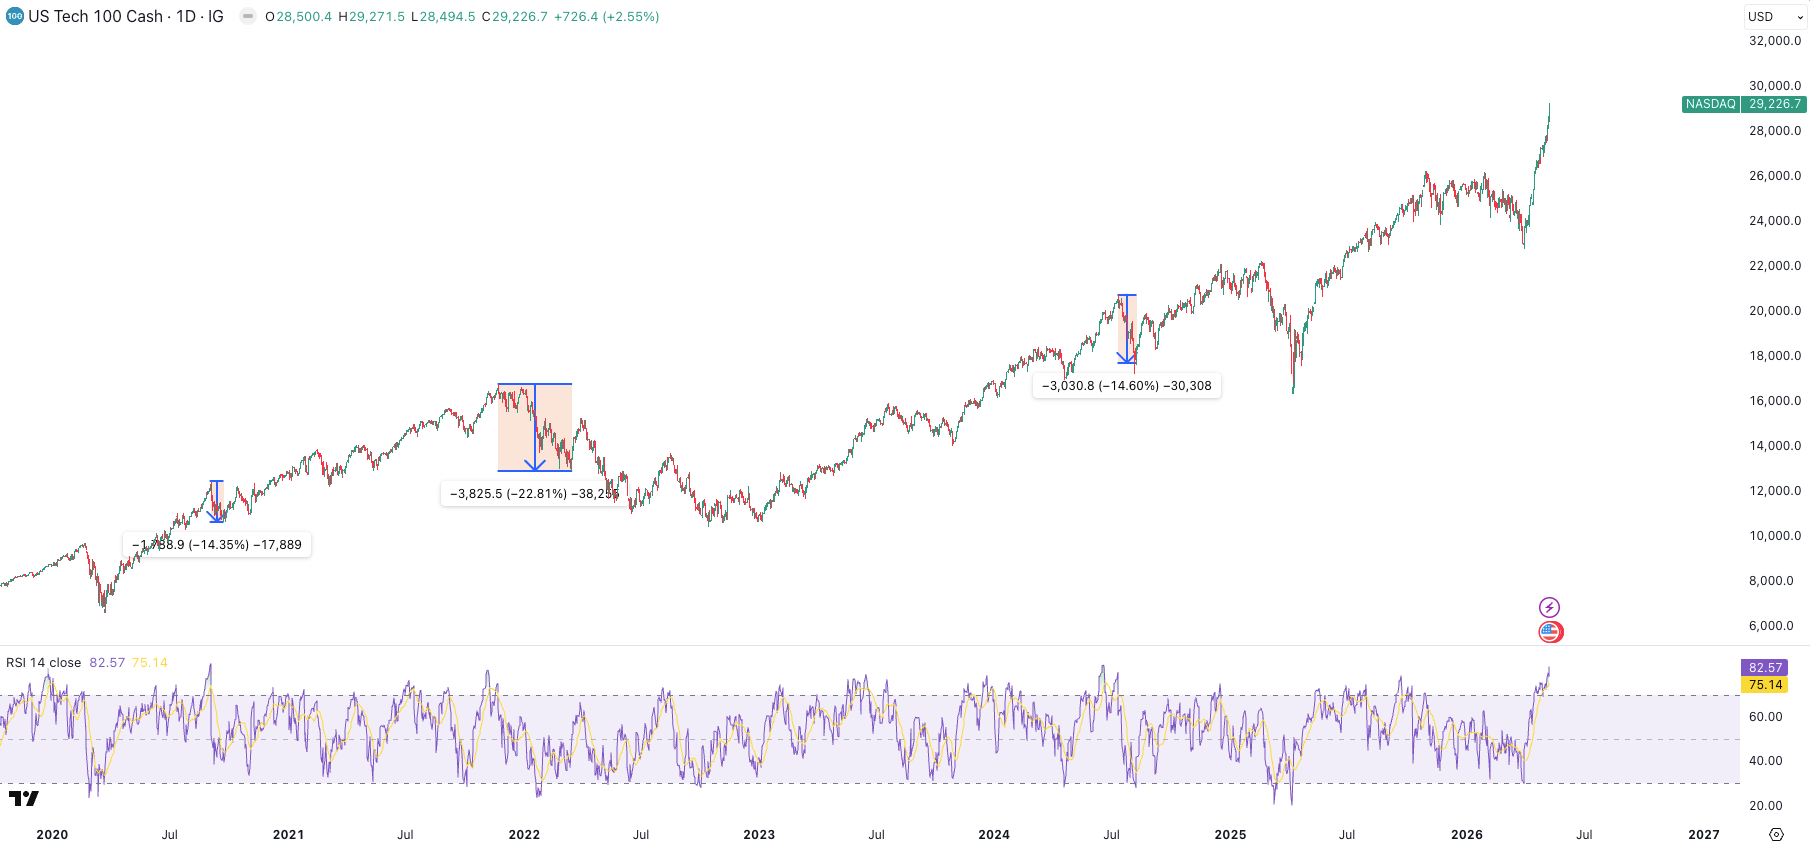
That does not mean equities have to roll over immediately. It means that the equity tape looked more crowded than BTC on a short-horizon momentum basis.
Macro
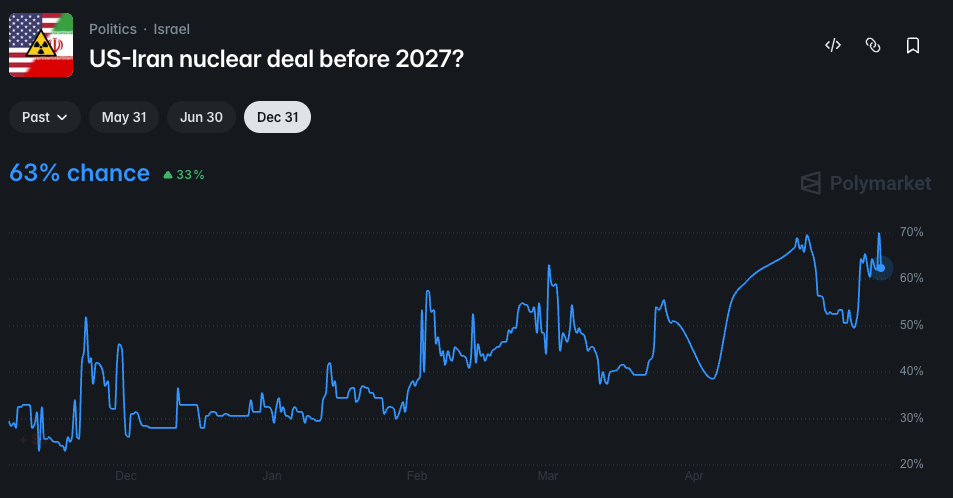
Macro still held the steering wheel, and oil remained the hinge variable. Brent settled at $114.44 on 4 May after renewed escalation around Iran and Hormuz, then dropped to $100.06 on 6 May as hopes of a temporary agreement improved, and finished 8 May at $101.29 after another volatile session in which traders again weighed ceasefire signals against renewed exchanges of fire.
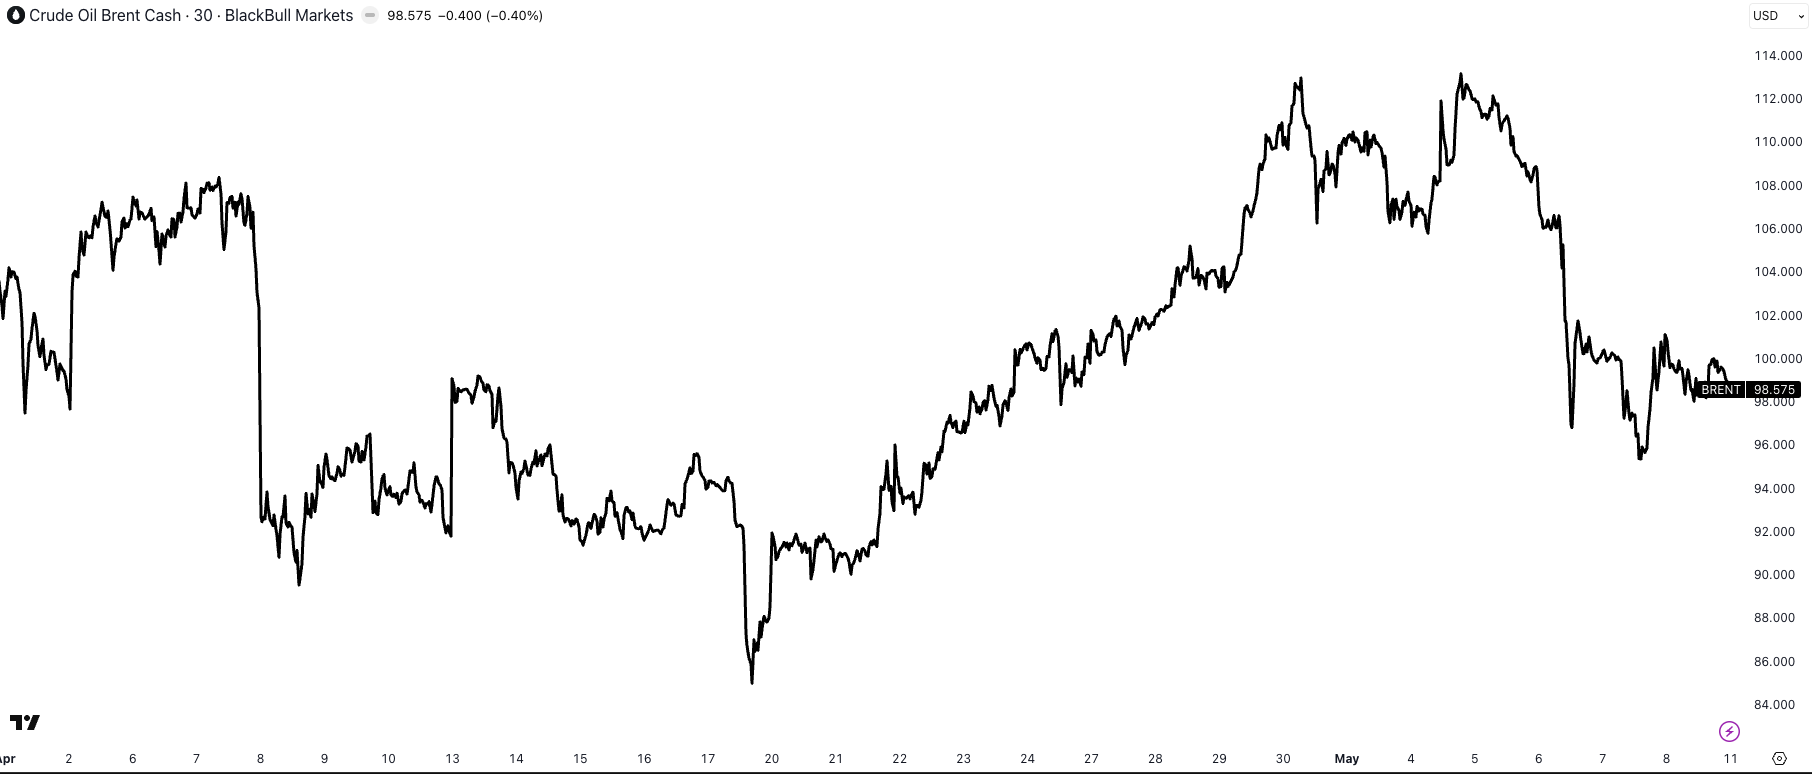
That sequence mattered because it was exactly the transmission mechanism we discussed last week: lower oil eased immediate inflation pressure, which reduced pressure on rates, which helped equities, which in turn helped BTC.
The Federal Reserve had not been given a clean answer either. On 29 April it left rates unchanged and explicitly said inflation was elevated, in part because of higher global energy prices. Powell’s term as chair was due to end on 15 May, while Senate leaders were targeting the week of 11 May for a confirmation vote on Kevin Warsh. Market was simultaneously pricing stubborn inflation, a still-resilient economy and a live leadership transition at the Fed.
The data reinforced that awkward mix. April payrolls rose by 115,000 and unemployment held at 4.3%, first-quarter GDP grew at a 2.0% annualised pace, March headline PCE ran at 3.5% with core PCE at 3.2%, and ISM manufacturing held at 52.7 while input-cost pressure remained intense. Growth was still there. Inflation was still uncomfortable. That combination did not kill the rally, but it did make the rally increasingly dependent on the market’s willingness to look through valuation and policy risk.
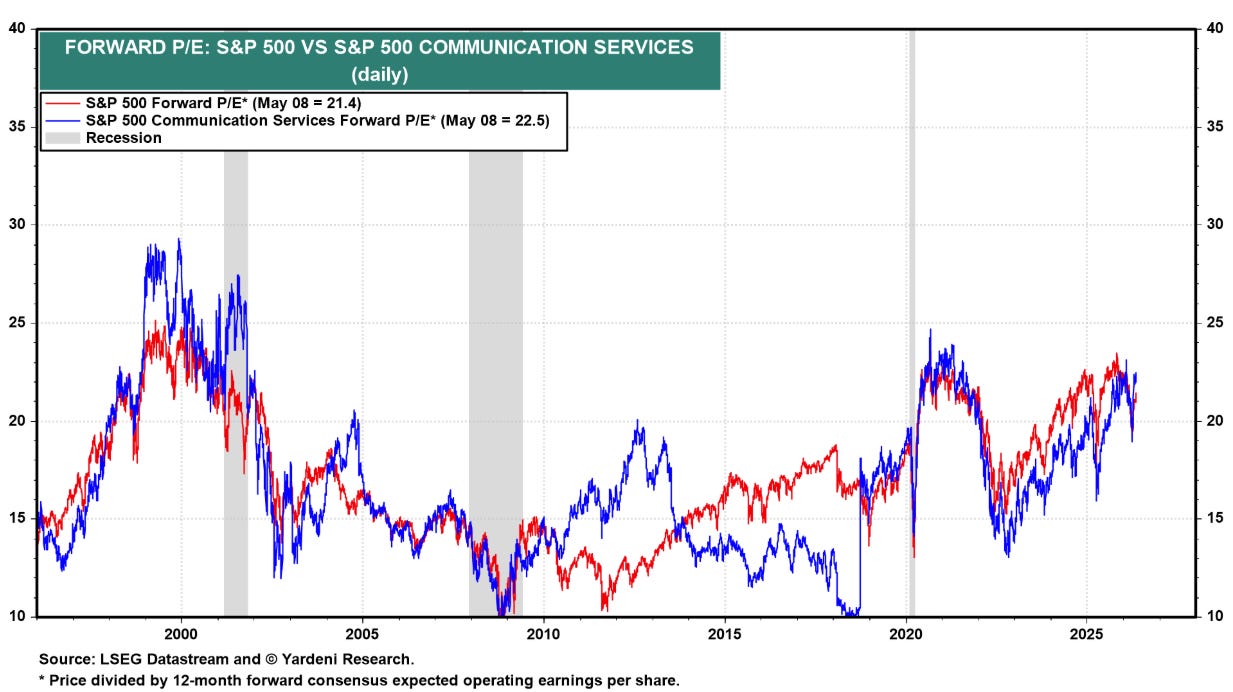
That was why the US equity market looked a bit rich into the weekend. The S&P 500 and Nasdaq had both printed fresh highs, but valuation already sat above historical averages and the AI complex remained the dominant driver of marginal optimism. Forward 12-month P/E ratio for the S&P 500 at 21.0, above both the five-year and ten-year averages
Wall Street strategists were becoming more bullish because of AI-driven earnings momentum. Markets can of course stay expensive for longer than seems rational, but they rarely stop being expensive just because people notice.
The Week Ahead
Into the new week, the diary was set to stay heavy.
US CPI due on Tuesday 12 May
US PPI on Thursday 14 May.
The Federal Reserve calendar showed the weekly H.4.1 balance-sheet release on Thursday, industrial production on Friday 15 May, and a 14 May speech from Governor Michael Barr specifically on the balance sheet.
Meanwhile, Reuters reported that Chinese Vice Premier He Lifeng would meet a US delegation in South Korea on 12-13 May, ahead of a Trump-Xi summit in Beijing scheduled for 14-15 May.
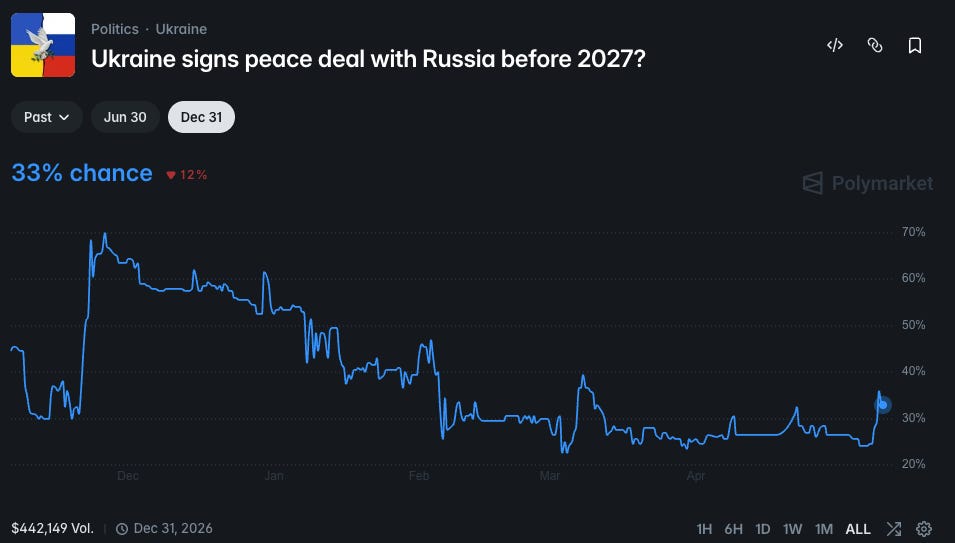
Geopolitics also remained live rather than solved. Russia and Ukraine had agreed to a US-backed three-day ceasefire for 9-11 May, but both sides quickly accused each other of violations. US and Iran exchanged fire earlier in the week even as Trump insisted the ceasefire still held. In other words, the market had compressed some of the war premium, but it had not eliminated the geopolitical risk that fed into oil, inflation expectations and broader cross-asset volatility.
Crypto also had an identifiable policy catalyst on the horizon. The Senate Banking Committee formally scheduled an executive session for 14 May to consider H.R.3633, the Digital Asset Market Clarity Act of 2025. That mattered because it offered the market a real regulatory tailwind.
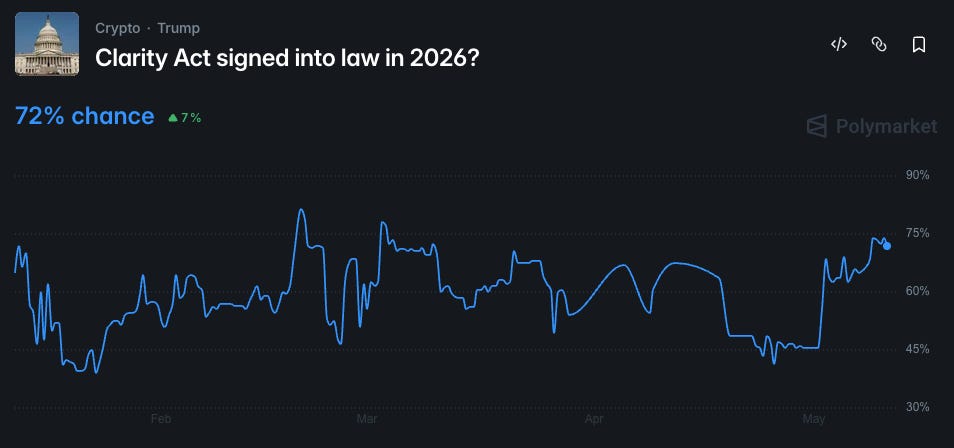
But it was still only a committee step, not the end of the process, so it should have been treated as incremental progress rather than a final unlock.
Closing view
The simplest way to frame the week was that last week’s levels worked. BTC did close above $78,000, it did take out $80,000, and it did end the week in a position where the mid-$80,000s remained the next zone to test. That was constructive. ETH, meanwhile, remained a support-hold chart rather than a leadership chart. Under the surface, selective higher-beta participation improved, but the move still looked more like an organised extension than the start of a broad alt euphoria phase.
The bigger point, though, was unchanged. Macro still drove the tape. US equities were richer, more euphoric and more obviously overextended than crypto, and that mattered because BTC was still trading in sympathy with that broader risk complex. If equities kept levitating and oil stayed contained, BTC probably still had room to carry momentum higher. If the Nasdaq’s extreme stretch finally triggered the sort of correction that overbought conditions often invite, we still doubted BTC would withstand it in isolation. The market had improved, but it had not become independent.
Last week’s closing instruction was effectively to watch oil, watch $80,000 and watch macro. This week, $80,000 gave way. Oil mattered every day. Macro still mattered most.