


BTC spent the last week in a choppy, post-breakdown regime: rallies were sold, dips were bought, and the market still looked more like range repair than trend continuation. The tactical question remains whether BTC can reclaim prior support levels, rather than whether it can bounce a few percent.
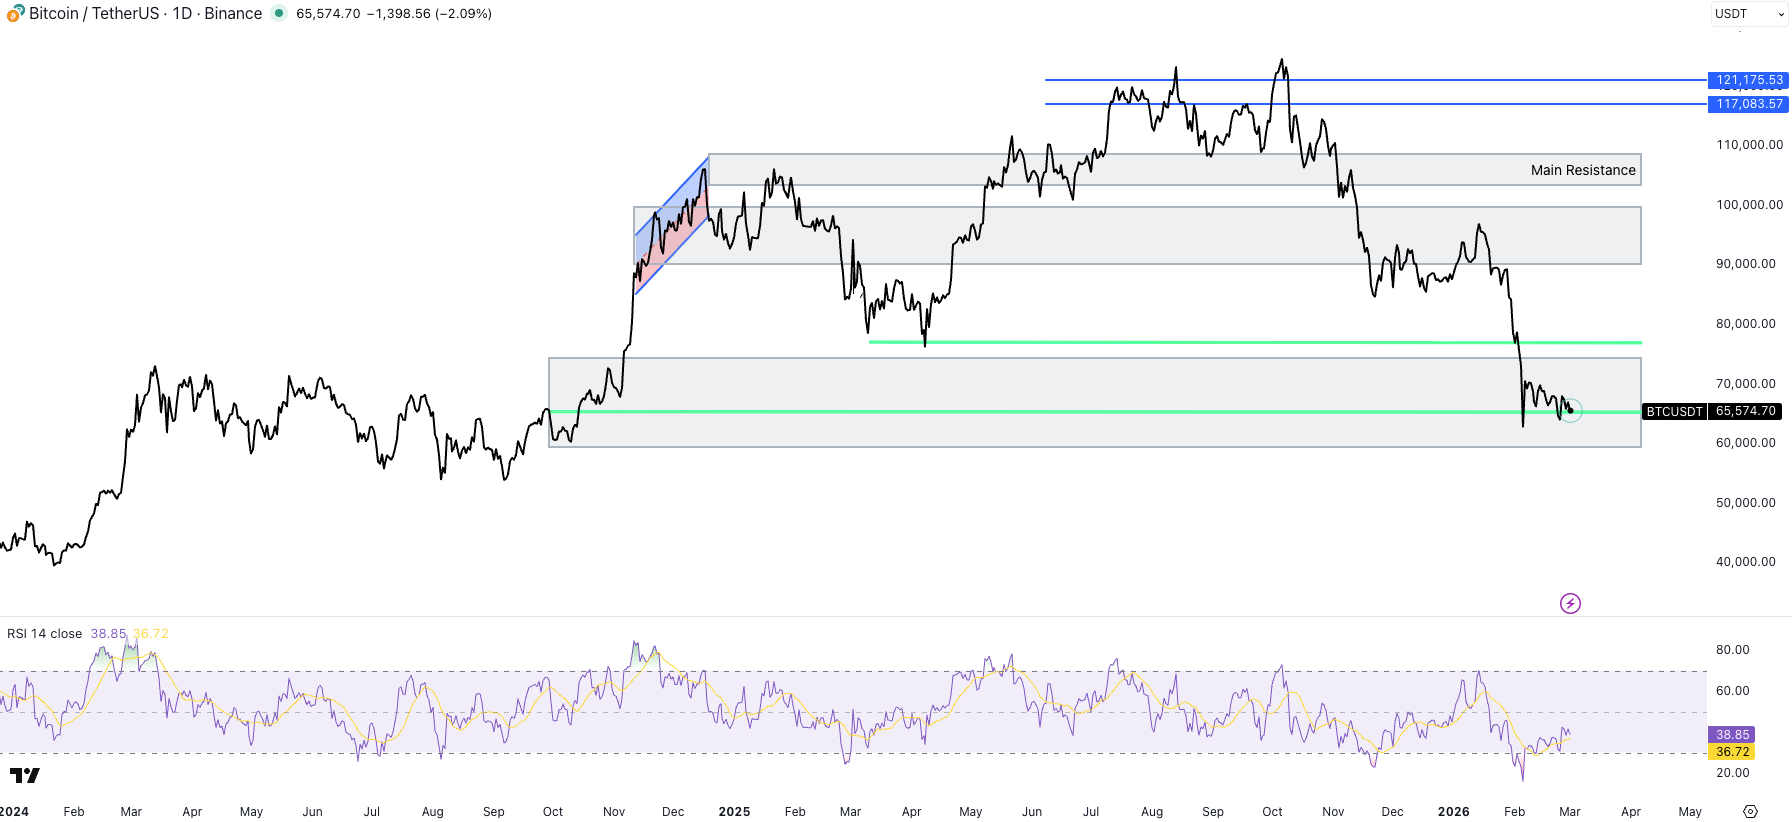
The key reclaim area remains 73–74k. That zone is the cleanest line in the sand for bulls because it would flip the late-February structure from lower highs to something that can sustain higher lows. Above that, the next supply to work through sits around the prior consolidation band in the low-90s into ~100k. Until 73–74k is reclaimed, rallies are still best understood as mean-reversion inside a larger drawdown.
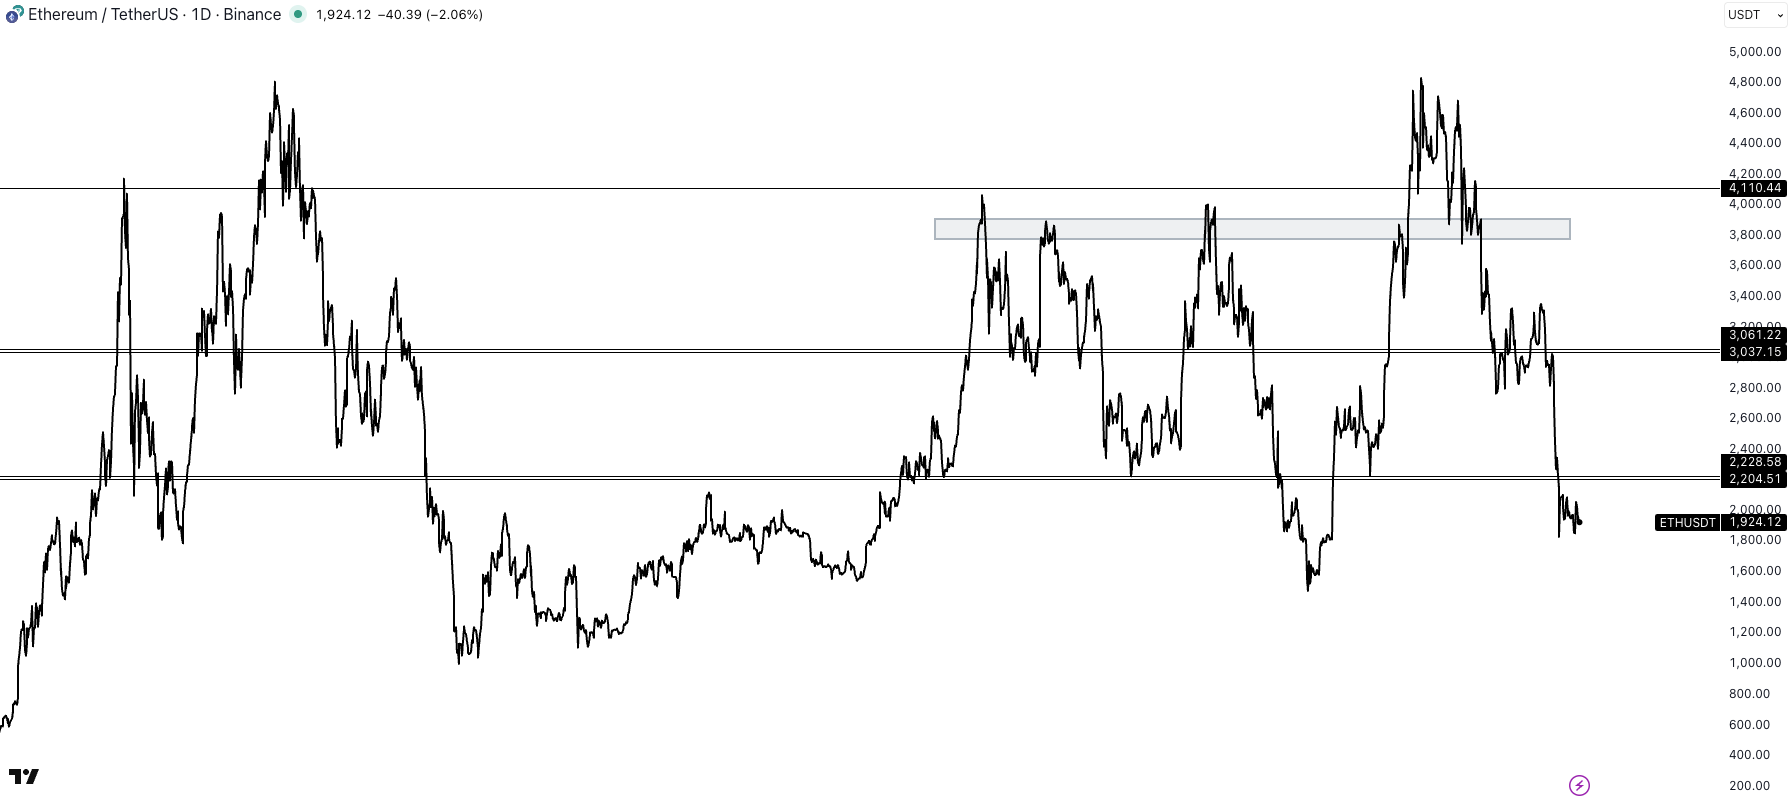
With BTC in repair mode, ETH is still in damage control. This a defense phase, not a reclaim phase. Any bounce below 2,200 is still just relief unless ETH can start rebuilding structure
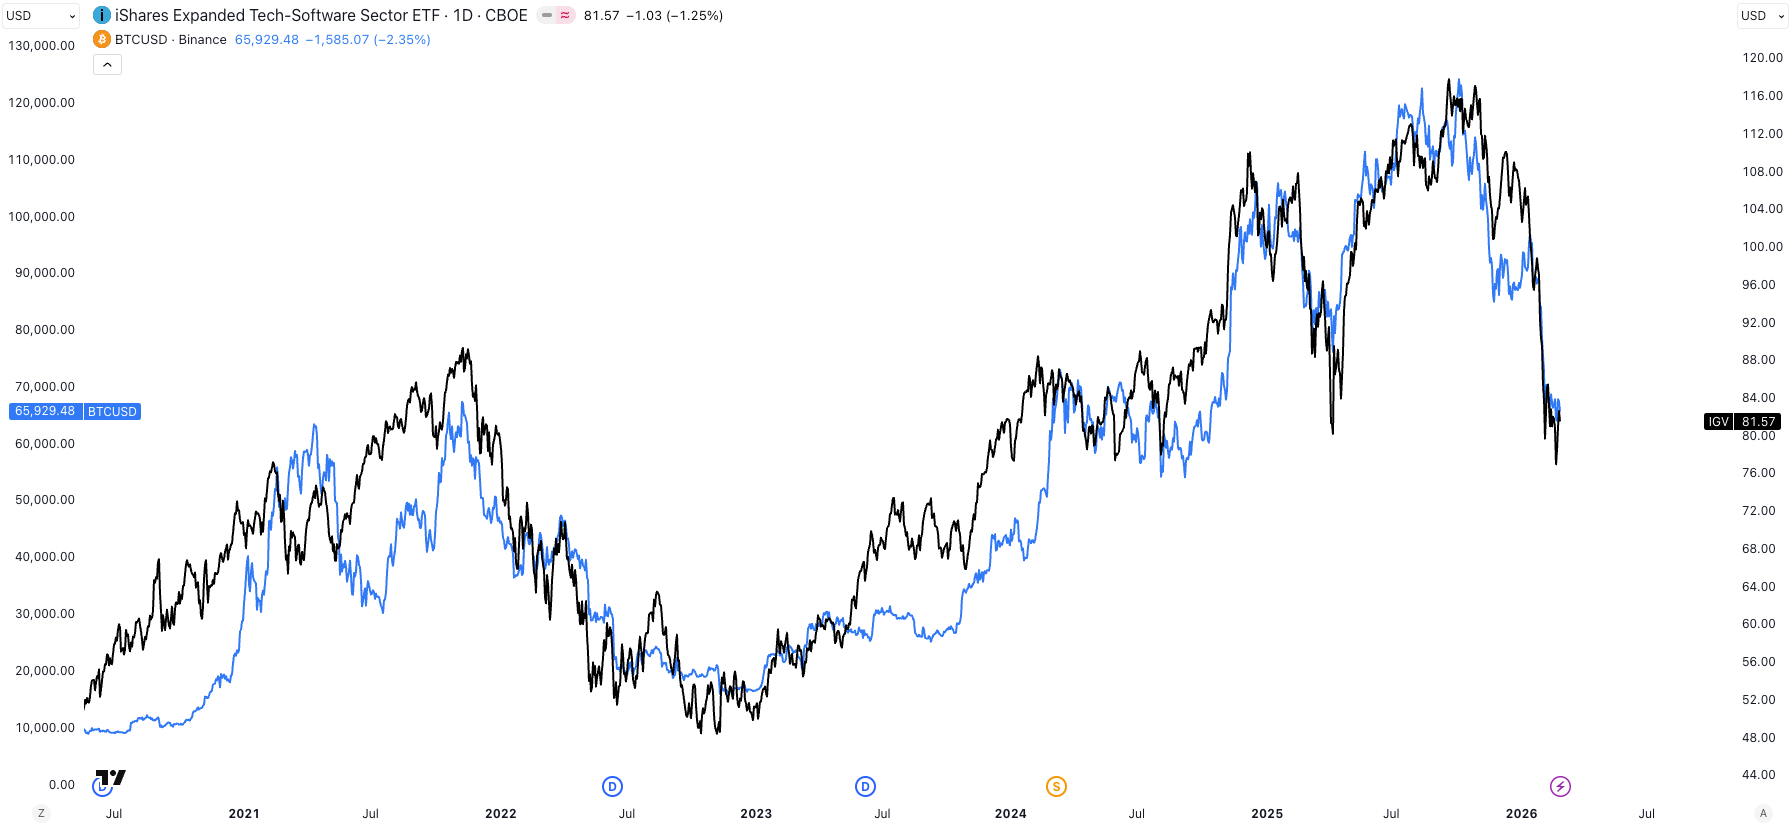
BTC is still trading like high-duration risk, and its path remains visually tethered to iShares Expanded Tech-Software Sector ETF (IGV) (software/tech risk appetite). This does not mean “BTC equals IGV”, but it reinforces that the marginal driver is still macro risk appetite, not a crypto-only catalyst.
Crypto fear & greed is back near the lows (10/100), and equities have slipped into clear fear territory as well (43/100), sentiment across risk assets is fragile. That kind of positioning can create reflex bounces, but it also means markets are sensitive to macro shocks.
From here, the key variables to monitor are WTI, the VIX, and the U.S. 10Y yield. If oil continues to grind higher, it risks feeding inflation expectations and pushing yields up, a headwind for duration assets like tech and crypto. A sustained move higher in the VIX would confirm broader de-risking. Conversely, if oil stabilises, the VIX fades, and the 10Y drifts lower, that combination would materially improve the odds of a BTC reclaim and broader risk stabilisation.
On the policy front, the CLARITY Act remains the most obvious potential “local catalyst” for sentiment. That kind of clarity matters most when macro risk is elevated, because it can tighten the dispersion between “institutionally acceptable” exposure and “headline-risk” exposure.
Sector performance
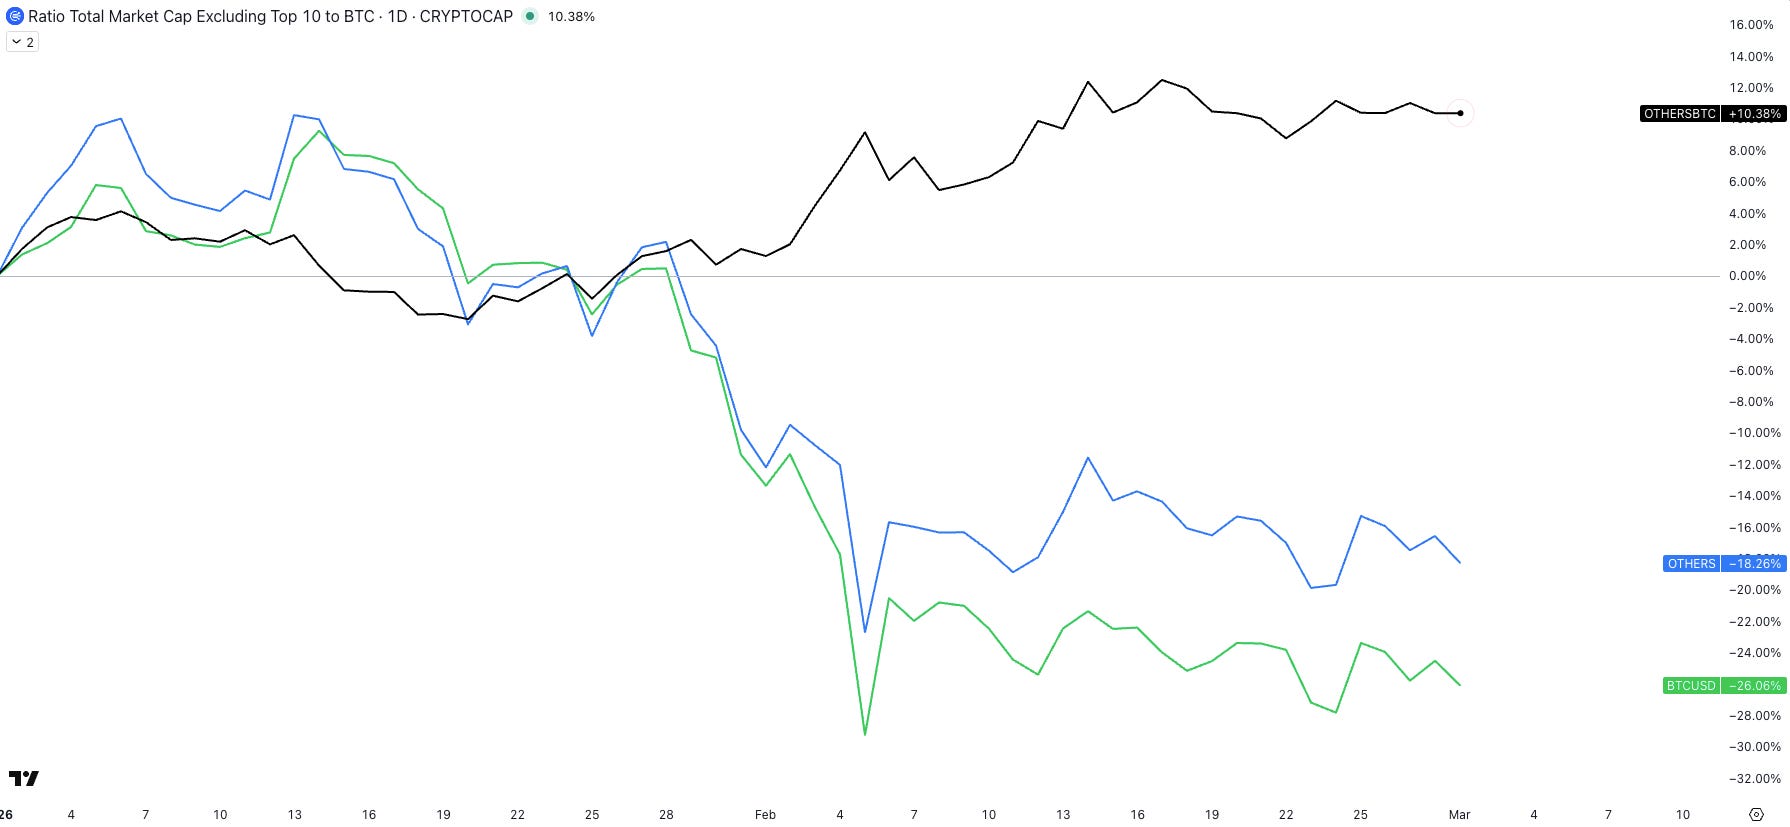
Despite how heavy everything feels in USD terms, OTHERS/BTC is actually up roughly 13% YTD. That’s an important signal. It tells you that, on aggregate, alts have held up better than BTC this year. This is not altseason, but it’s also not a pure BTC-dominance regime. Broad alt beta has quietly outperformed on a relative basis even while absolute prices look weak.
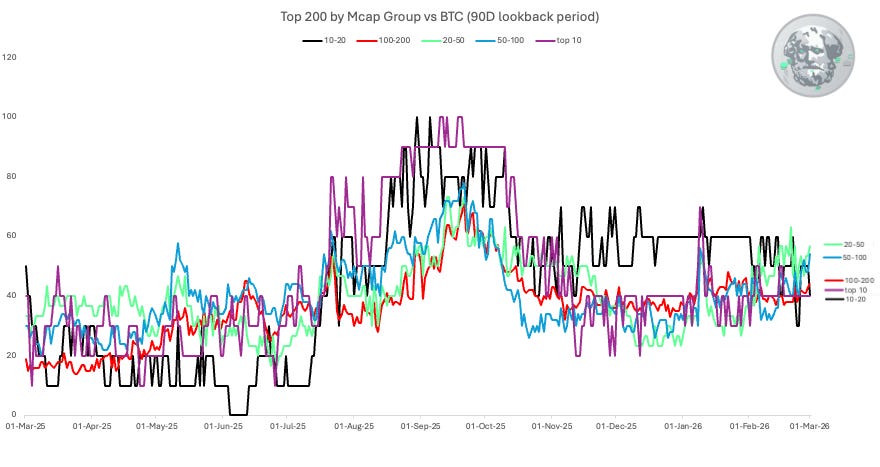
If you zoom out to top 200 vs BTC, the picture is similar but more nuanced. The dispersion is wide. Out of the top 200, 48% of digital assets have outperformed BTC over the last 90 days.
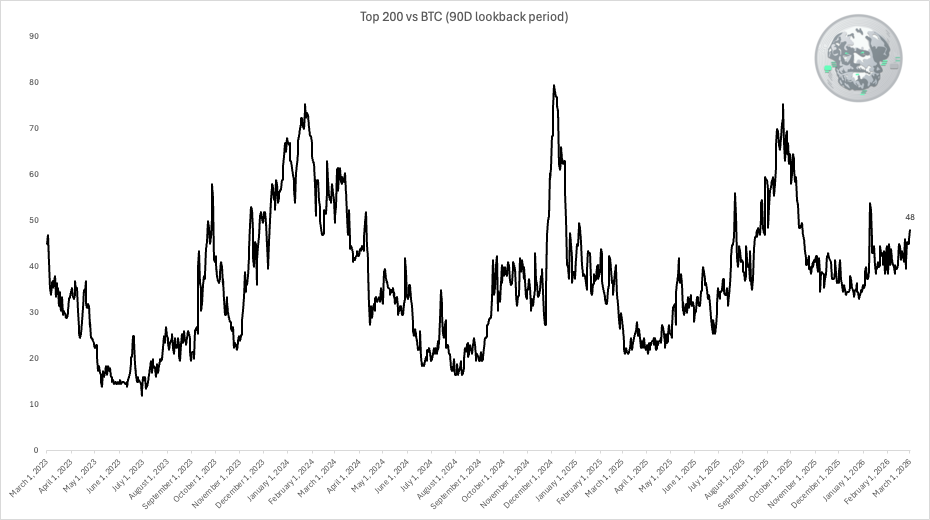
Some of the larger-cap alts have struggled, but the broader tail of the market has held up relatively better than BTC. That reinforces the idea that this is a selective rotation environment rather than a BTC-led melt-up or an across-the-board alt collapse. Leadership is rotating, not disappearing. Part of the explanation is also idiosyncratic triggers of short term outperformance as well as the illiquidity
Looking at sectors YTD in USD, the dashboard still shows widespread drawdowns. Most sectors are materially negative on the year. On an absolute basis, it’s been a risk-off tape. But that’s only half the story.
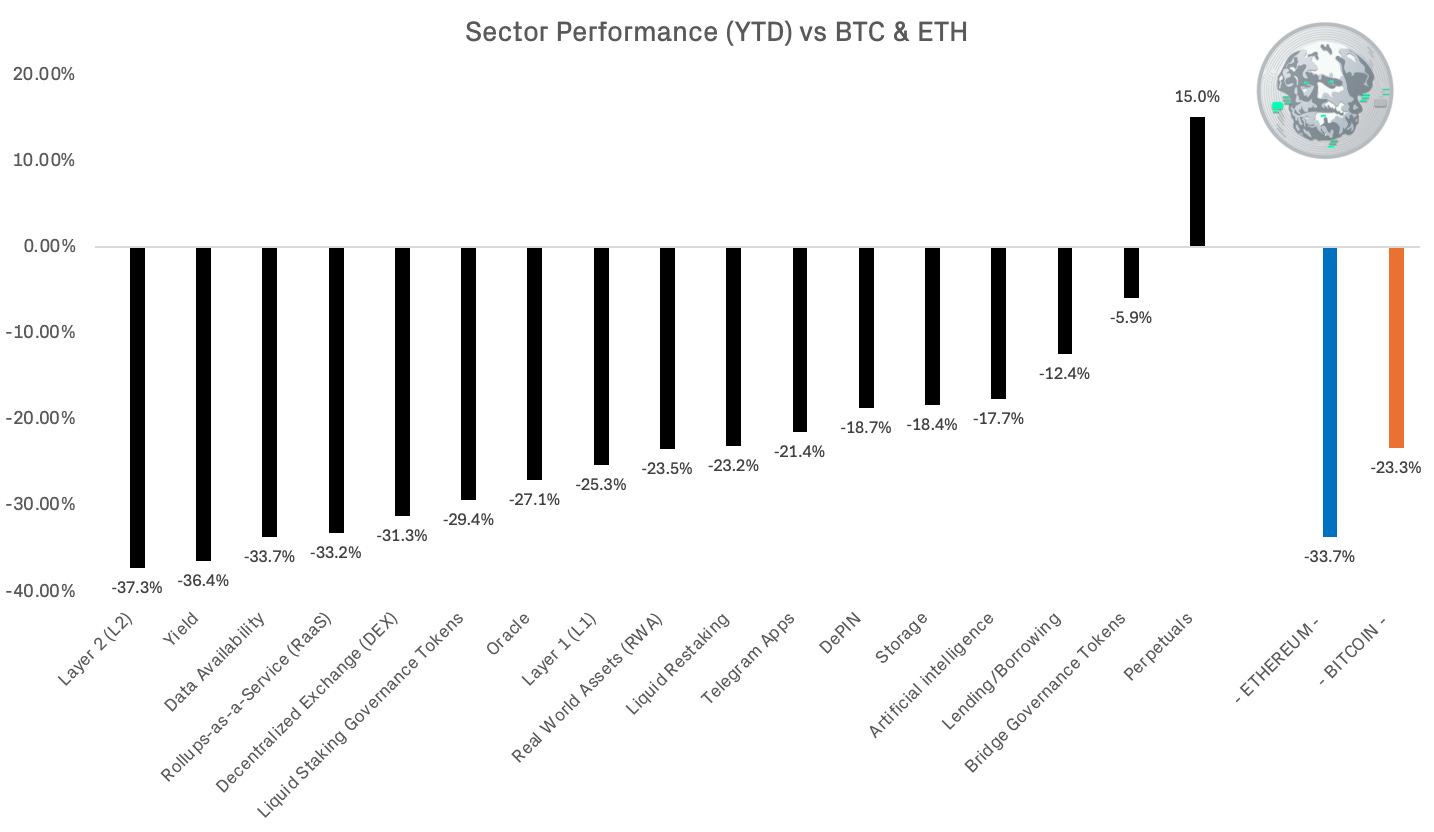
In USD terms, most sector still shows widespread drawdowns YTD; however, the more actionable framing is BTC-relative performance. When BTC is down materially YTD, “down less than BTC” in USD becomes “up versus BTC” mechanically, and that relative tape is what drives rotation inside crypto risk.
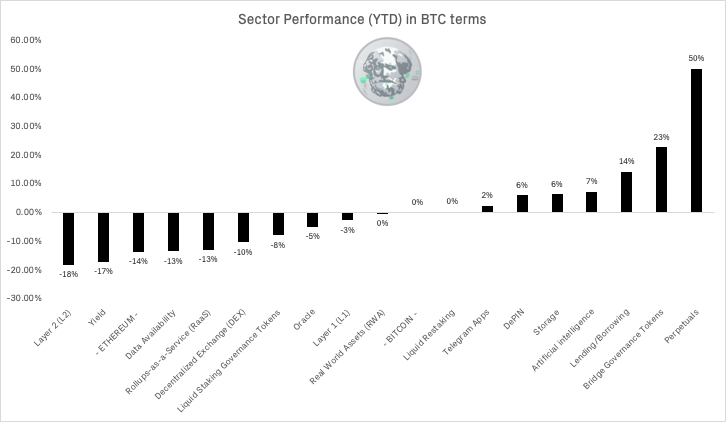
This lines up with the observation that OTHERS/BTC is up ~13% YTD: broad alt exposure has held up better than BTC on a relative basis, despite poor absolute performance.
Flows and positioning
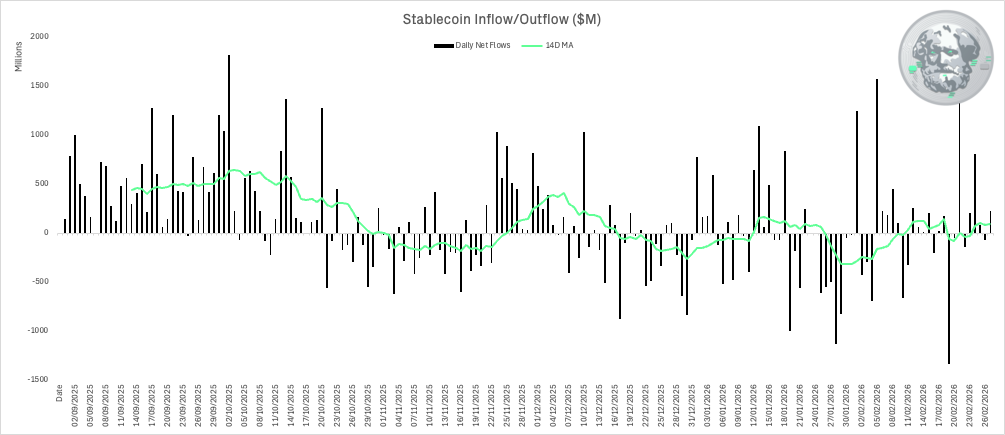
Stablecoin flows are still constructive, but they’re not screaming upside. Net inflows remain positive, with the 14DMA sitting around ~$89m. That’s below the six-month average of ~$125m and still comfortably under the $200–300m/day zone that has historically aligned with cleaner, more sustained upside trends. The message here is simple: liquidity is present, but it isn’t accelerating. This is stabilisation flow, not expansion flow.
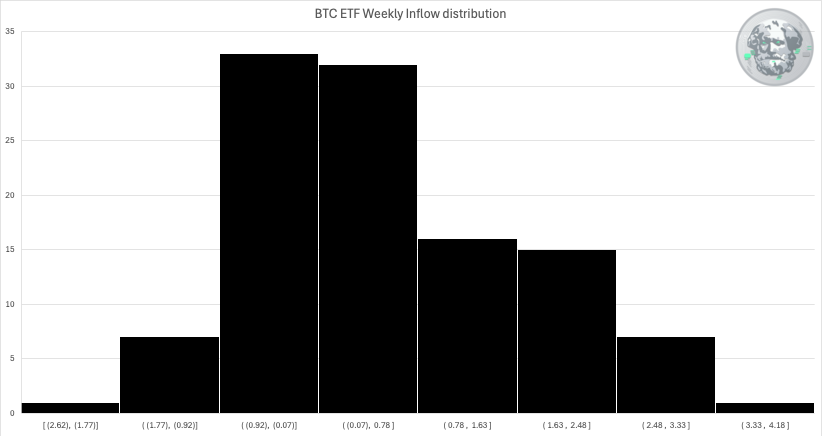
The more encouraging data point came from U.S. spot BTC ETFs. For the Feb 23–27 (ET) week, net inflows totalled roughly ~$787m, driven by three solid sessions mid-week. Importantly, this was the first green weekly print after a multi-week stretch of outflows, signalling a re-engagement of demand at lower levels.
In context, ~$0.8bn is supportive, but it’s not euphoric. It ranks as the second-strongest weekly inflow of 2026 so far, behind the early-January re-engagement phase that included a ~$697m single-day print. What stands out more than the headline number is the distribution: flows have moved back into the middle of the historical weekly range rather than printing an extreme tail event. That’s consistent with buyers stepping back in, but not chasing.
One important nuance: ETF “net inflow” data reflects primary-market creations minus redemptions at the fund level, not secondary-market trading volume. It doesn’t fully capture intraday sentiment shifts. That’s why pairing ETF flows with stablecoin flows and cross-asset risk indicators like IGV still provides the cleaner read on overall positioning.
Macro
Macro remains “fine, but not easing fast enough”. The week’s key inflation impulse was firmer producer pricing. January U.S. Bureau of Labor Statistics data showed an upside Producer Price Index print, with services components featuring prominently in commentary around the release.
On growth, the headline was weaker but noisy: the U.S. Bureau of Economic Analysis advance estimate for Q4 2025 real GDP came in at 1.4% SAAR, down sharply from Q3’s pace. This is soft enough to keep “late-cycle” narratives alive, but GDP prints are often dominated by composition, seasonal quirks, and revisions.
Labour market stress still isn’t apparent in weekly claims. U.S. Department of Labor reported seasonally adjusted initial claims of 212,000 for the week ending 21 Feb—low in historical context.
Confidence is subdued but not collapsing. February The Conference Board showed a modest uptick in headline confidence (91.2), while the University of Michigan final February sentiment index was 56.6.
Surveys have flashed “better” recently, notably Institute for Supply Management, where January manufacturing PMI rebounded to 52.6 with stronger new orders in Reuters’ recap. But it is difficult to put a lot of weight on one or two higher survey prints given how unreliable the signalling value has been over recent years.
This week’s macro gatekeepers are February ISM (released on the first business day) and February nonfarm payrolls. These matter because reclaiming 73–74k in BTC is much easier with a benign rates impulse and a risk-on equity session than via a purely crypto-native squeeze.
Geopolitics and the oil shock
The geopolitical story became the dominant macro risk heading into March. Reporting describes joint United States and Israel strikes on Iran, with immediate market focus on energy supply disruption risk.
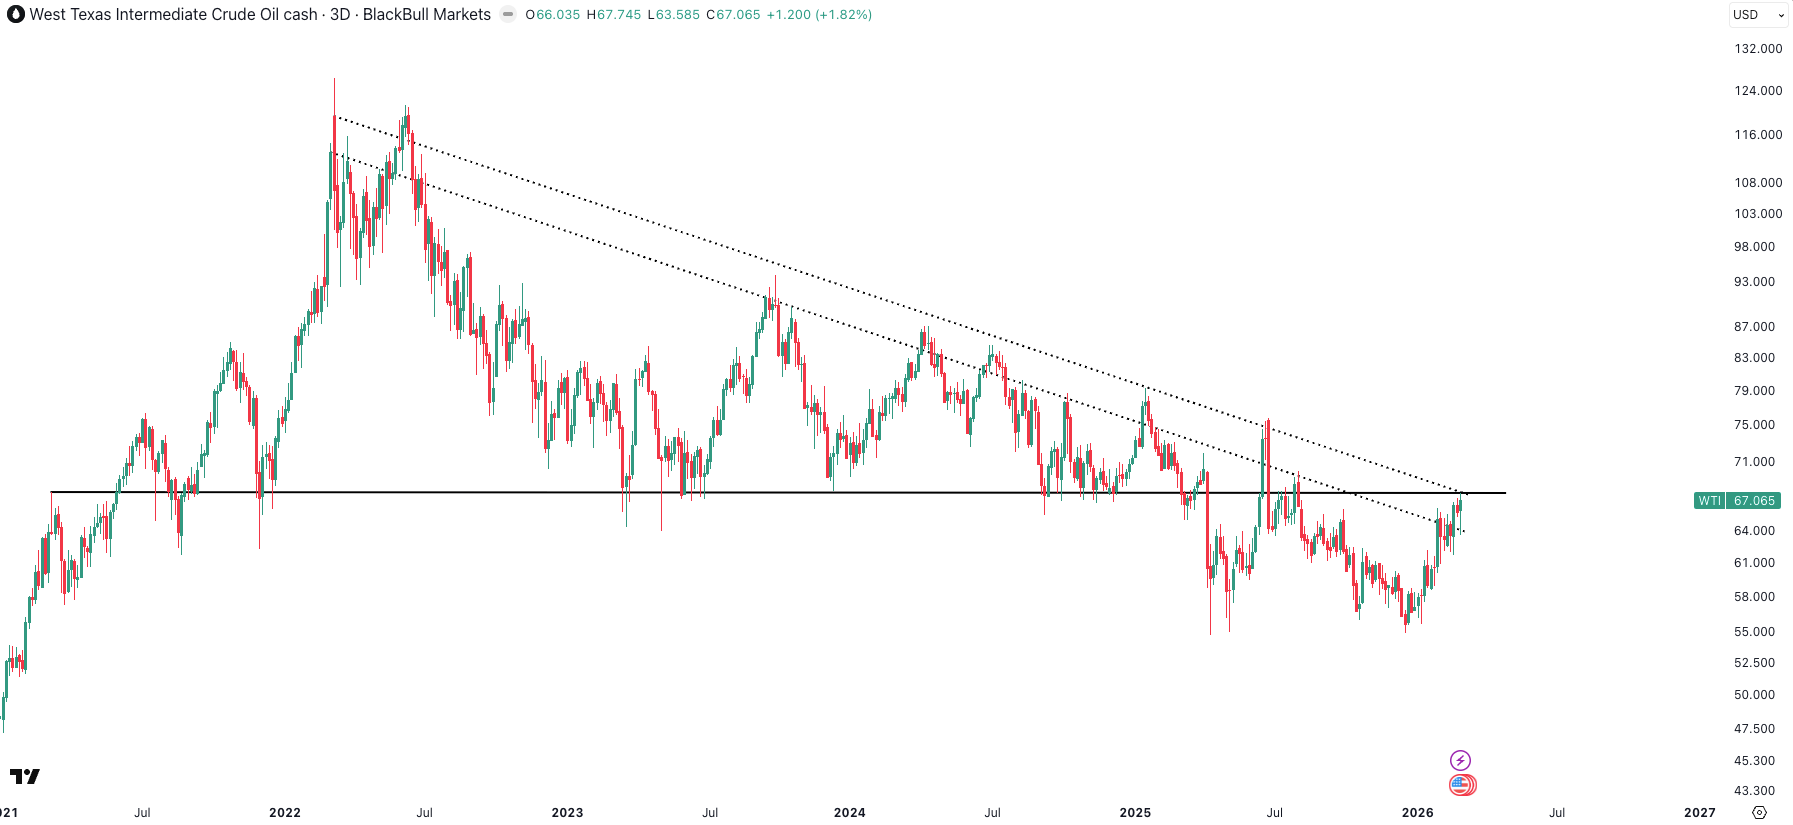
Oil’s reaction explains why this matters for crypto. Reuters described a sharp jump (around 10%) and highlighted risk around the Strait of Hormuz, a key energy chokepoint through which roughly a fifth of global oil flows. If this shock translates into sustained higher energy prices (towards $90–$100), the second-order effect is more inflation sensitivity and, likely, a less dovish path from central banks.
Policy responses may help at the margin but do not remove the core risk. OPEC+ has been reported as agreeing a modest output increase of 206,000 bpd from April, but a meaningful transport disruption through Hormuz is a much larger shock than a small production adjustment can offset.
BTC after geopolitical shocks
To quantify the “buy the smoke of the cannon” idea, I ran a simple event study on BTC using daily data and a set of widely recognised geopolitical shock dates from 2019–2024. Forward returns are measured from the event-day close at 1 day, 1 week, 1 month, and 3 months.
Event Anchors Used
September 2019 – Saudi Abqaiq/Khurais attack
January 2020 – Soleimani strike
August 2021 – Fall of Kabul
February 2022 – Russia invades Ukraine
September 2022 – Russia partial mobilisation
October 2023 – Hamas attack on Israel
April 2024 – Iran–Israel strike episode
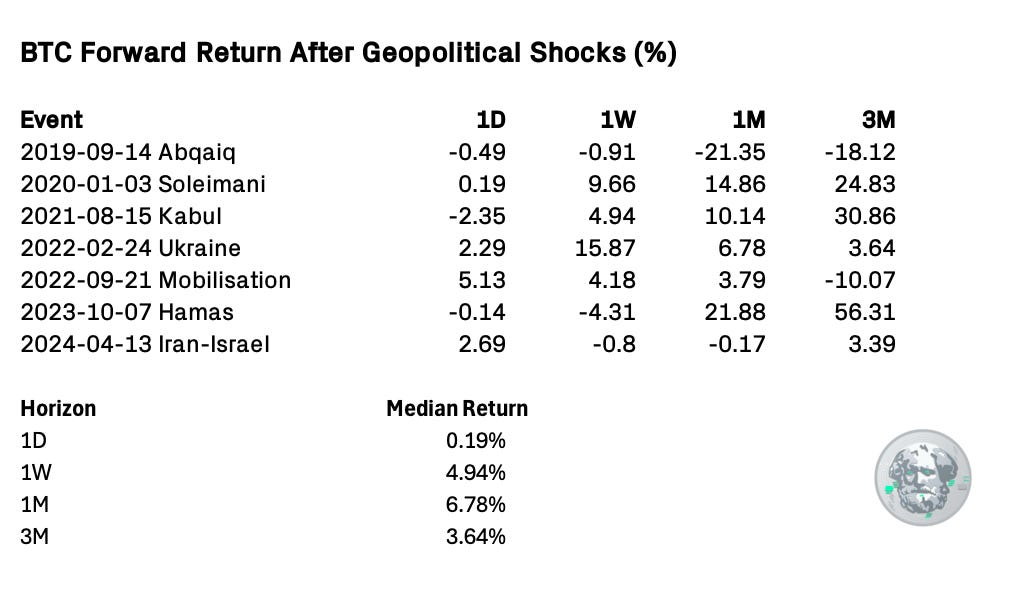
Across the 2019–2024 sample, the pattern is broadly consistent with the heuristic:
The 1D reaction is typically small and mixed — often just noise.
The 1W and 1M forward returns skew positive in most cases.
The 3M outcome is more dispersed, particularly in episodes where energy markets were directly involved.
In other words, BTC tends to stabilise quickly after geopolitical shocks, with better odds over the 1–4 week horizon. The exception is when the shock morphs into a persistent oil or inflation event that tightens financial conditions. That’s the key caveat.
The oil path matters more than the first candle.
Oil-Linked Shocks
(Abqaiq 2019, Ukraine 2022, Iran–Israel 2024)
1D: +2.29%
1W: -0.80%
1M: -0.17%
3M: +3.39%
Non-Oil Shocks
(Soleimani, Kabul, Mobilisation, Hamas)
1D: +0.03%
1W: +4.56%
1M: +12.50%
3M: +27.85%
The difference is clear:
Non-oil shocks tend to follow the classic “buy the smoke” pattern.
Weak/noisy 1D → strong 1W → stronger 1M and 3M follow-through.Oil-linked shocks are materially different.
The 1W and 1M medians are flat to negative, and the 3M recovery is much weaker.
That reinforces the key variable in the current environment: It’s not the geopolitical headline. It’s whether oil becomes persistent inflation pressure.
If oil stabilizes → history favors rebound.
If oil trends structurally higher → BTC’s recovery profile flattens materially.
Looking Ahead
There are three tactical gates to watch:
1. Structure:
BTC reclaiming 73–74k flips the short-term regime from repair to rebuild. Failure there keeps the market in chop.
2. Macro impulse:
February ISM and Nonfarm Payrolls matter because rates and equity tone still drive marginal flows. A benign rates move + stabilizing IGV materially improves the probability of reclaim.
3. Oil / risk complex:
WTI behavior, VIX direction, and the U.S. 10Y yield are the transmission channels.
Oil stable + VIX fading + yields drifting lower = constructive.
Oil trending toward $90–100 = inflation sensitivity returns, recovery flattens.
Positioning is fragile. Sentiment is fearful. Liquidity is present but not aggressive. That combination tends to produce volatility first, clarity second. Unless oil becomes the story, history favors stabilization over collapse. But until 73–74k is reclaimed, the burden of proof remains on the bulls.