


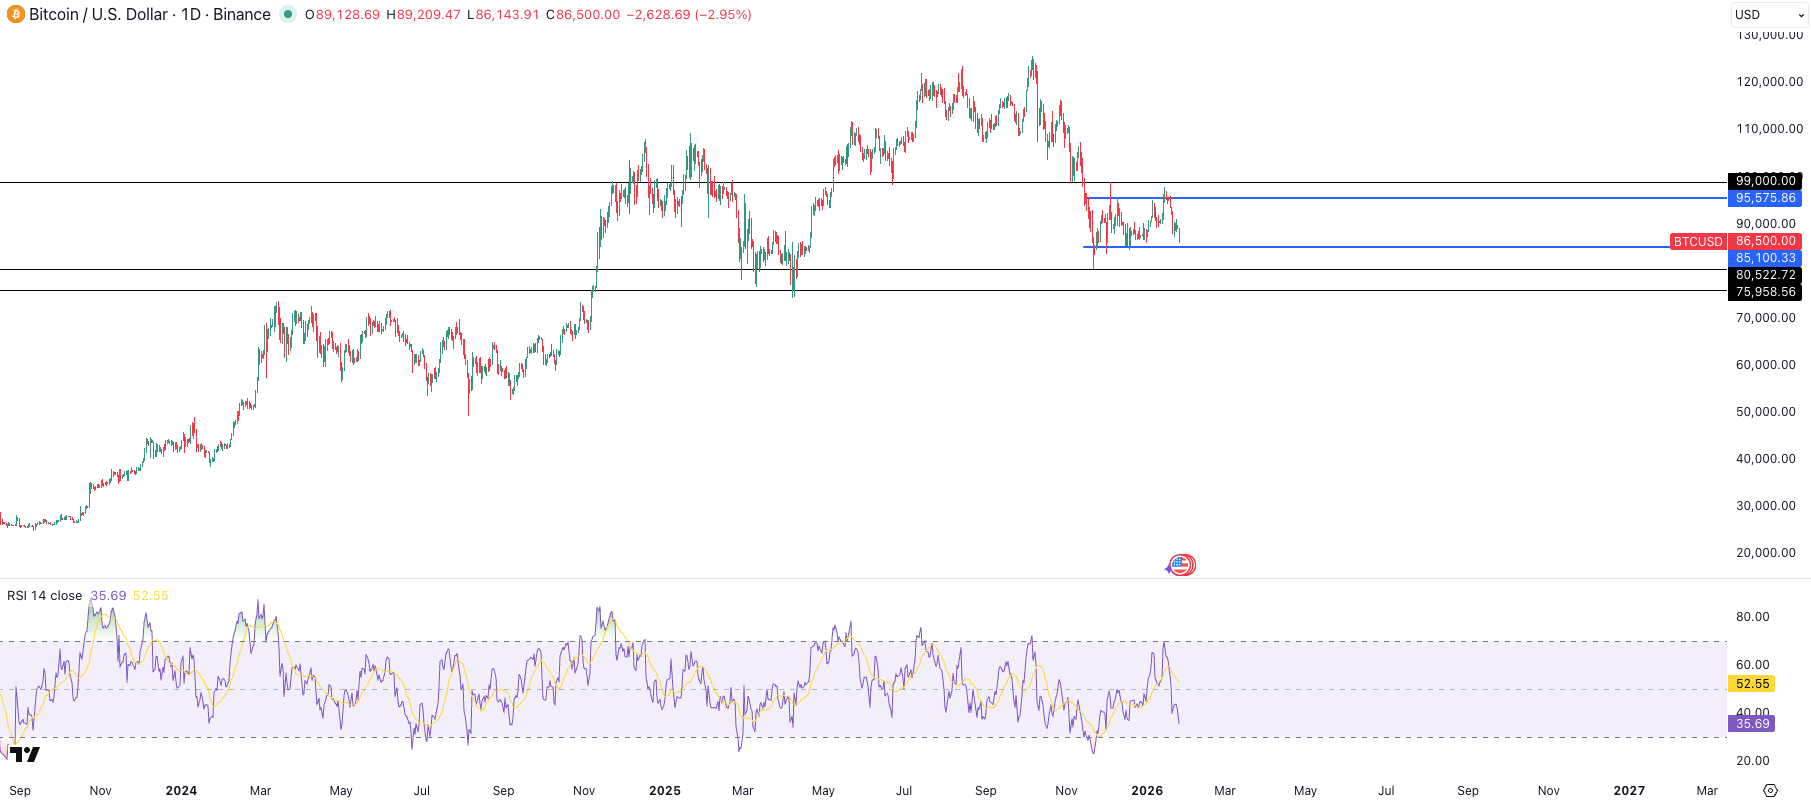
Another week, another macro overhang. Bitcoin slipped back into the $85-95k range as risk assets broadly repriced two overlapping policy shocks: Japan’s brewing currency crisis and Washington’s looming government shutdown. The playbook remains consistent, macro sets the tempo, crypto follows with a lag. Last week it was Greenland rhetoric and tariff announcements that spooked markets over the weekend. This week, the damage came from Tokyo and DC simultaneously, catching an already thin market off-guard.
BTC needs to reclaim $90k decisively to signal renewed strength. A retest of $85k cannot be ruled out, and the asset is not yet oversold on most timeframes. Until we see decisive macro clarity, whether from Japan’s February 8 election or resolution to the US shutdown drama, crypto is trading as a high-beta expression of global liquidity conditions, nothing more.
The real story this week isn’t in crypto charts. It’s in cross-asset volatility, carry trade dynamics, and the return of fiscal policy as a market-moving force.
If there's one lesson from the past two weeks, it's this: macro drives everything. The Greenland narrative and weekend tariff announcements rattled traditional markets on Monday, but Bitcoin didn't react until 44 hours later, a full 1.5-day delay. That lag is the tell. When BTC used to lead or at least track equities in real-time, it signaled strong positioning and tight reflexivity. Now? The 1.5-day delay screams low participation. The marginal crypto buyer has left the building. Volumes are anemic. The market is reacting, not anticipating.
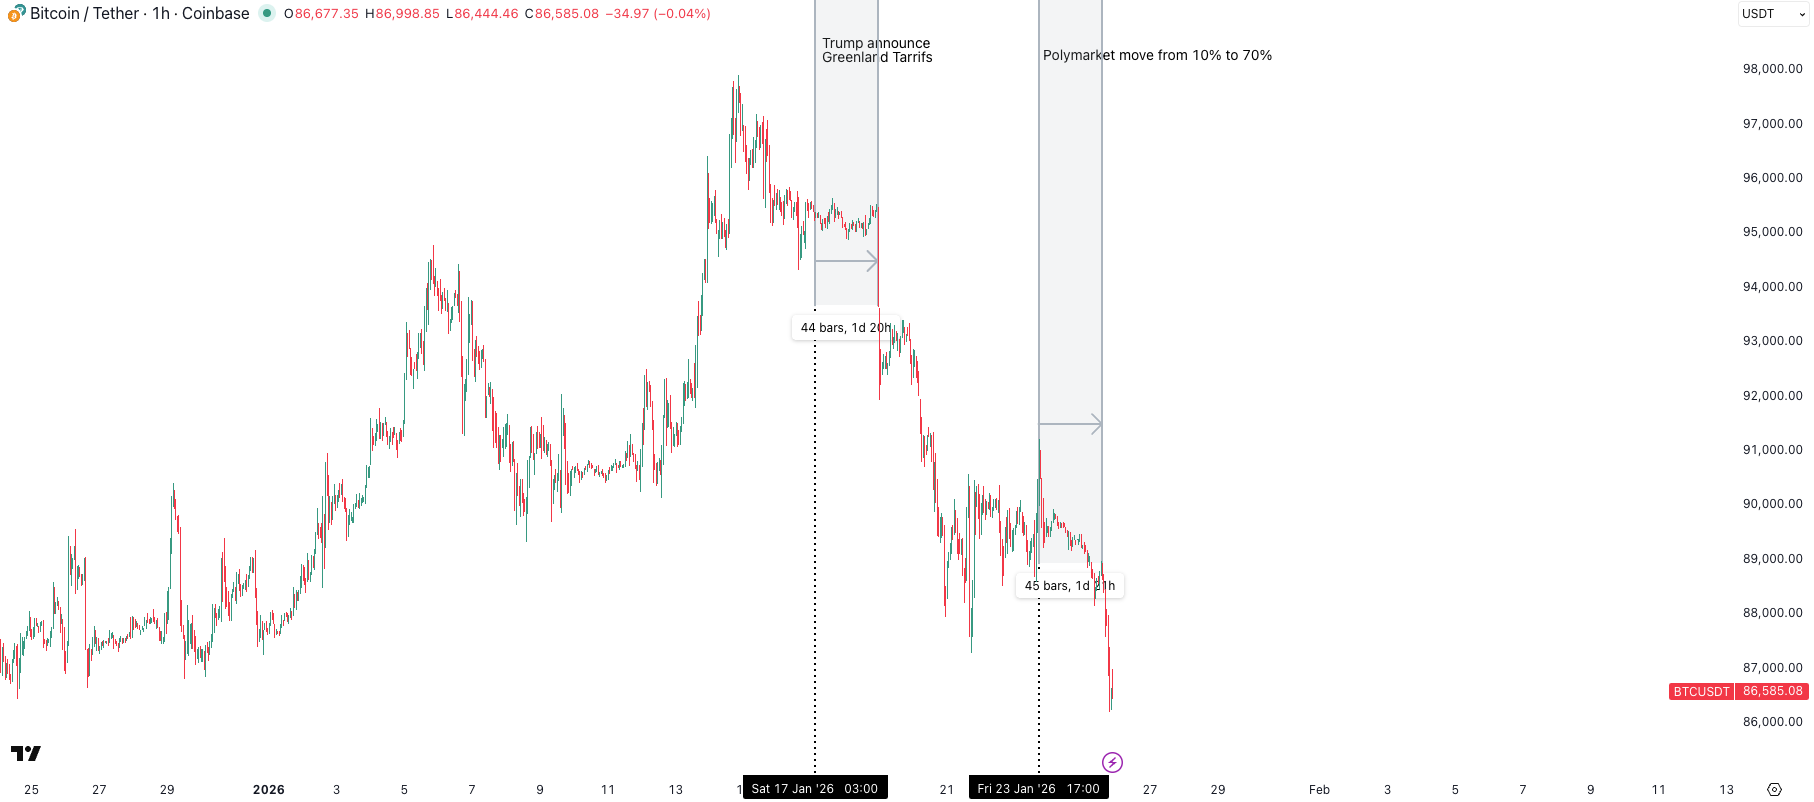
Then came the second shock: the Polymarket probability of a January 31 government shutdown spiked from 10% to 70% in a matter of days, and Bitcoin again reacted with a 45-hour lag (1d 21h). Same pattern.
The explanation is simple: participation is thin. Crypto volumes are well below their Q4 2025 peaks. Retail is sidelined. Institutional flows are muted. The marginal buyer and seller are both absent, which means BTC is trading as a passive beta play on macro liquidity rather than an active, narrative-driven asset.
This is a feature, not a bug, of the current regime. Until either:
Crypto-native catalysts return (ETF inflows, regulatory clarity, stablecoin net inflows), or
Macro conditions improve (Fed easing, Japan stability, shutdown resolution),
...expect BTC to remain a high-correlation, low-conviction trade.
Macro
Japan - A slow motion crisis
What Actually Happened This Week
Thursday’s Bank of Japan meeting was unremarkable, they held rates at 0.75%, one dissenter wanted a hike, markets barely moved. Standard central bank theater.
Friday was a different story. The yen suddenly strengthened hard. No clear catalyst, just violent price action that looked like either someone unwinding a massive position or actual intervention. Then at 11 a.m. New York time, right when global FX markets have peak liquidity, the Federal Reserve made an announcement: they were checking rates in the yen market.
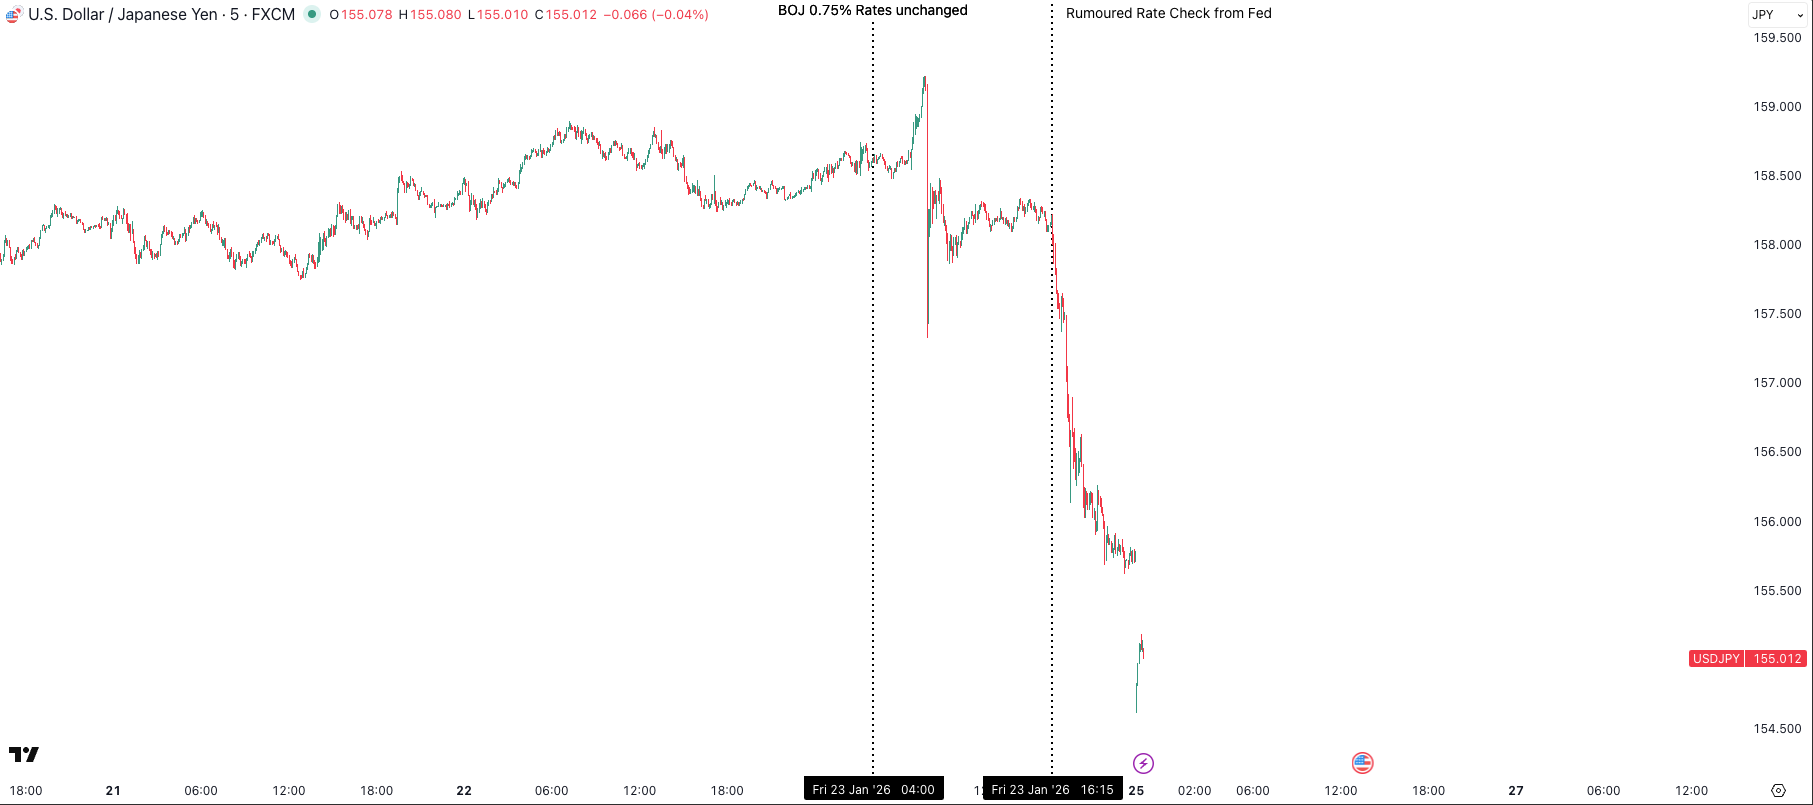
This wasn’t Japan asking for help. This was the US making a move. When the Fed publicly checks FX rates, it’s essentially a policy declaration. It means either the US Treasury wants the yen stronger, or they’re coordinating something bigger with Japan (and possibly Korea, given recent comments from Treasury Secretary Bessent about Asian currency weakness).
The market got the message immediately. The yen rallied hard into the close, and suddenly everyone with yen-funded carry trades started getting nervous.
Why the Carry Trade Matters
For the past 18 months, one of the most crowded trades in global markets has been borrowing yen (cheap at 0.75% rates) and buying higher-yielding assets—US bonds, stocks, crypto, whatever. With leverage, it’s been essentially free money.
The problem: when the yen strengthens rapidly, this trade unwinds in a hurry. Positions get liquidated. Risk assets sell off. We saw this movie in August 2024, the yen spiked, and within 5 days global equities were down 5-12%, VIX hit 65, and crypto got crushed alongside everything else.
If the US is now actively pushing for a stronger yen, that same dynamic could replay. And unlike August 2024 (which was a surprise BOJ hike), this time there’s warning.
What Happens Next
There are a few ways this plays out:
If this was just a warning shot: Japan and the US jawbone markets for a few days but don’t follow through with real intervention. The yen steadies, carry trades calm down, and we move on. Risk assets probably bounce on relief.
If they’re serious about intervention: We see coordinated action Sunday night or Monday, traditionally when Japan likes to move. The yen strengthens another 3-5%, carry positions unwind aggressively, and risk assets (including crypto) sell off for 1-2 weeks before finding a bottom.
If something bigger is brewing: This could be the start of a coordinated US-Japan-Korea currency agreement (similar to the 1985 Plaza Accord but in reverse). Strengthen Asian currencies, those countries buy more Treasuries, and global capital flows shift for months. This would be the most structurally important outcome and the most disruptive to existing positioning.
The February 8 Inflection Point
Japan’s snap election on February 8 is the key event to watch. Prime Minister Takaichi called the election to secure a mandate for her “Sanaeconomics” fiscal expansion: a ¥21.3 trillion stimulus package, a 0% food sales tax, and massive infrastructure spending—all unfunded by revenues, financed entirely by bond issuance.
The BOJ is stuck. Inflation is running at 2.9%, well above target. Wage growth is 5.25%, the highest since 1991. The yen is weak, importing more inflation. By any orthodox measure, the BOJ should be hiking rates aggressively. But it can’t, because:
The JGB market is fragile (40-year yields hit 4.24%, highest in 30 years)
The government needs low rates to service >260% debt/GDP
Fiscal dominance is winning, the BOJ is prioritising government funding needs over its price stability mandate
If Takaichi wins big on February 8, expect more fiscal expansion, more JGB issuance, and more pressure on the yen. That increases the odds of a forced BOJ response (emergency hike) and a violent carry trade unwind.
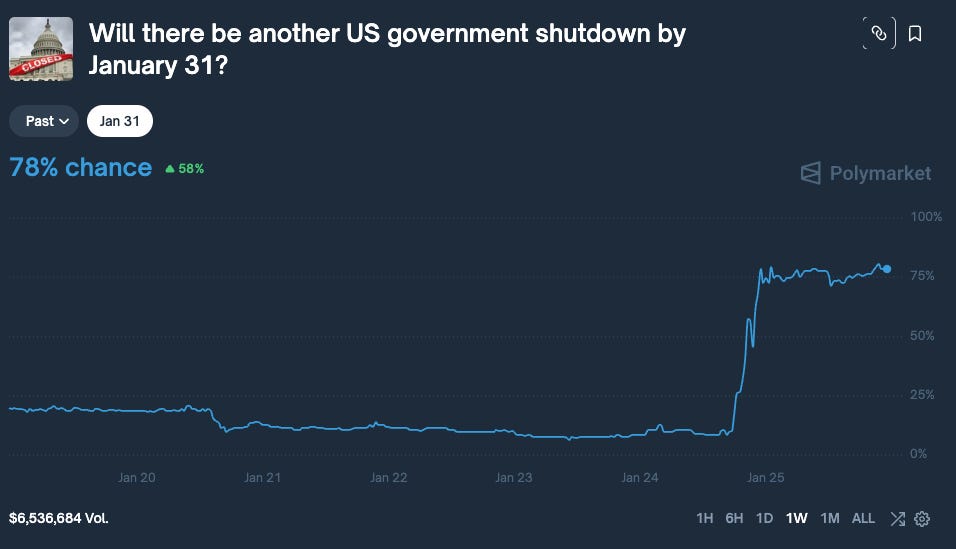
US Government Shutdown
There's now an 78% probability that the US government shuts down by January 31. If that sounds dramatic, it's not, government shutdowns have become routine political theater in the last decade. But the market mechanics around them are predictable and worth understanding.
When Shutdowns Actually Hit Markets
The pattern is consistent across the last five shutdowns (2013, Jan 2018, Feb 2018, Dec 2018-Jan 2019, and Oct-Nov 2025):
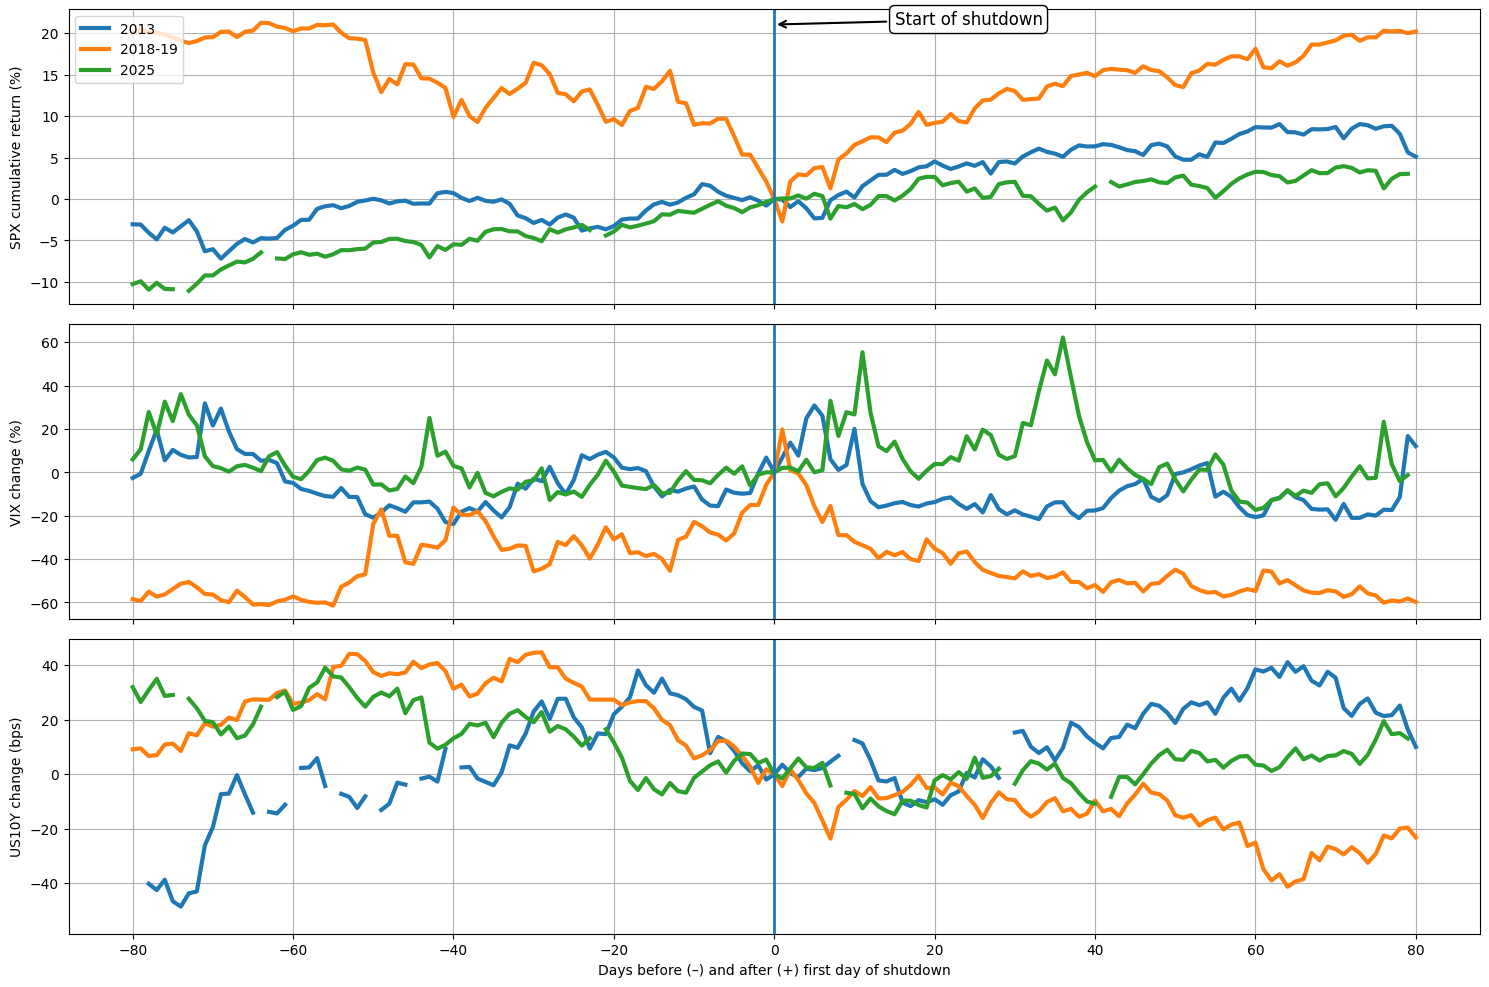
Phase 1 (Days –40 to –10): The real repricing happens here
Markets move before the shutdown, not during it. This is when probabilities shift, negotiations fail, and uncertainty peaks. Equities drift lower, VIX grinds higher, and Treasuries catch a bid as investors position defensively. This is where we are now.
Phase 2 (Days –5 to +5): Peak headline risk, but often a local bottom
VIX spikes around the actual shutdown date, but equities frequently stabilize or bounce as the “worst case” becomes known. The shutdown itself is usually the end of uncertainty, not the beginning.
Phase 3 (Week 2+): Duration becomes the issue
If the shutdown drags into week 2 or 3, real economic damage starts to show: missed federal paychecks, delayed government contracts, disrupted data releases (CPI, GDP, jobs reports). This is when markets start treating it as a macro shock rather than a political sideshow.
Phase 4 (Resolution): Fast relief rally
Historically, shutdowns end with a sharp bounce in equities, a collapse in VIX, and a reversal of whatever defensive positioning accumulated during the event.
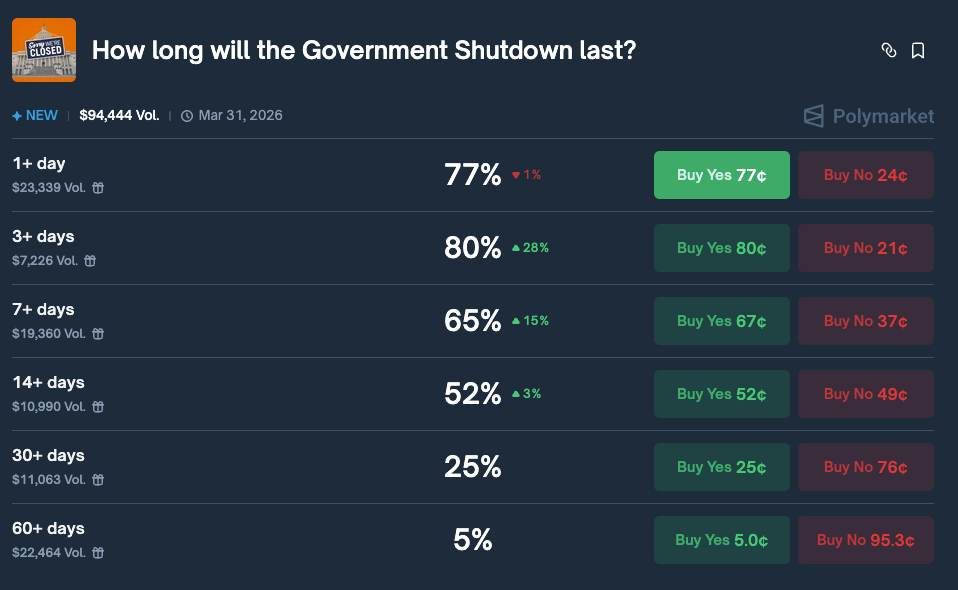
Currently market is pricing in 2-4 week shutdown.
The 2025 Template
The most recent shutdown ran from October 1 to November 12, 2025, 43 days, the longest in US history. The market impact was real but contained:
S&P 500 sold off modestly into the shutdown, then rallied post-resolution
VIX spiked from 15 to 22, then collapsed back to 14
US 10Y yields fell 15-20 bps (flight to safety), then reversed
Bitcoin tracked equities with a 12-24 hour lag
The key insight: shutdowns are volatility events, not structural crashes. Unless they overlap with a debt ceiling crisis (which is the real tail risk), they tend to be buyable dips rather than sell signals.
The TGA Factor
Here’s the under appreciated angle: the Treasury General Account (TGA), the government’s checking account at the Fed, is a key driver of financial system liquidity. During the 2025 shutdown, the TGA swung wildly as the government drew it down to pay essential services, then refilled it post-resolution. This directly impacts Fed net liquidity, which has been one of the most reliable leading indicators for risk assets over the past two years.
Net liquidity (Fed balance sheet – TGA – reverse repo) drives asset prices with a 4-8 week lag. If the TGA spikes higher (government hoards cash), liquidity tightens, and risk assets roll over 6-8 weeks later. If the TGA falls (government spends), liquidity expands, and assets rally with a lag.
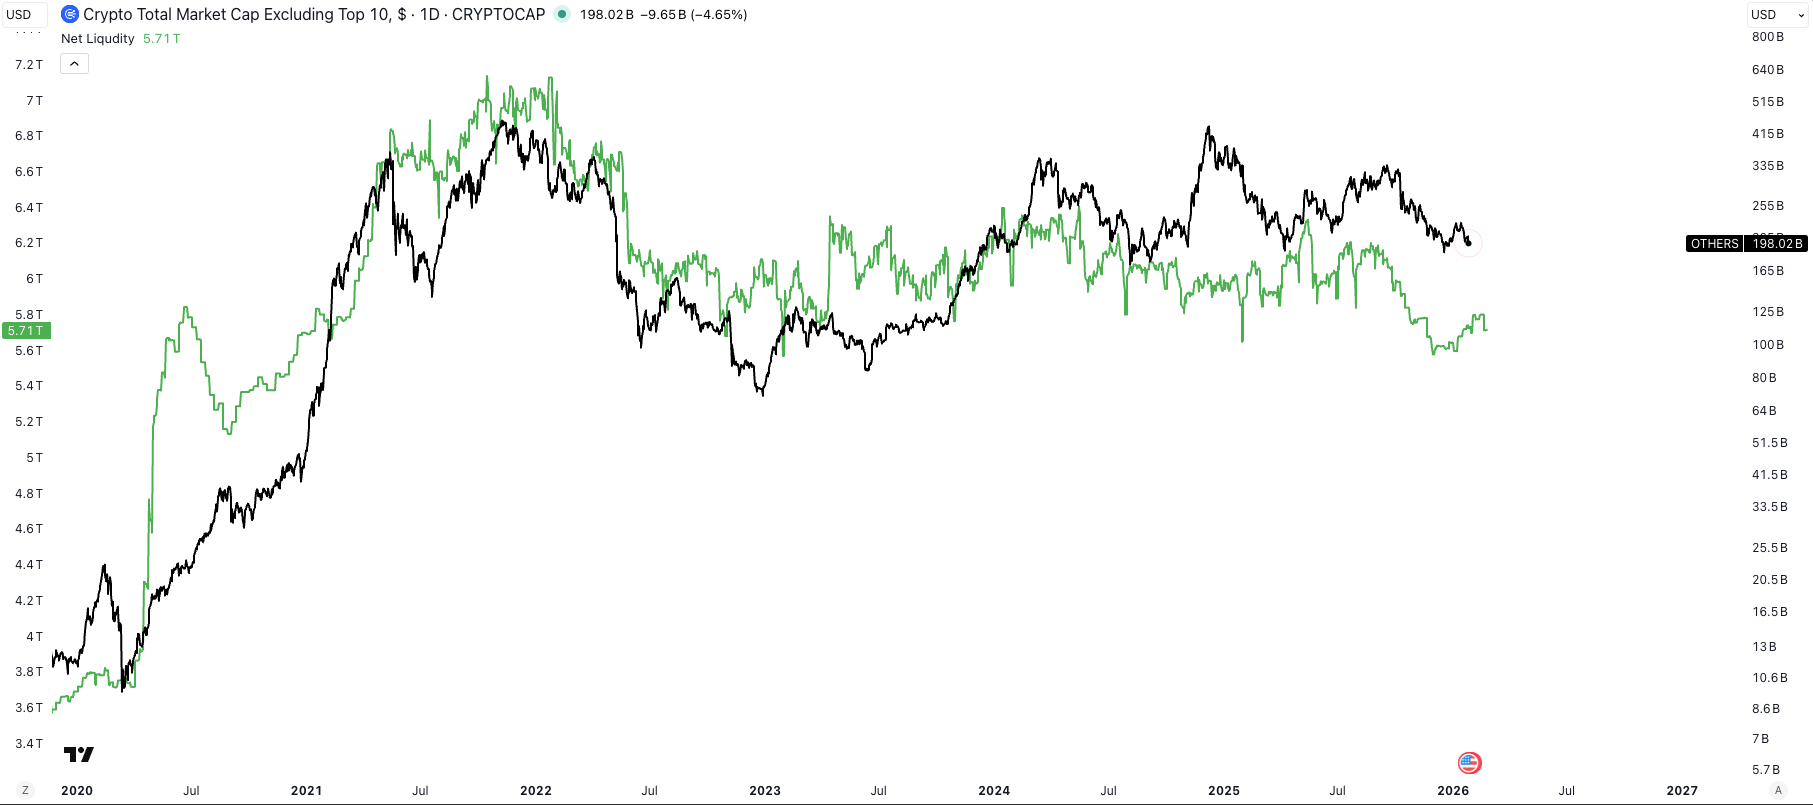
A prolonged shutdown could see the TGA drawn down significantly, injecting liquidity into the system. Current status: Net liquidity has been slightly increasing since mid-December 2025, which explains the supporive price action in January 2026.
What to Watch This Week
USD/JPY action Monday afternoon: is the MOF intervention real?
January 31 shutdown deadline: does it happen, and how long does it last?
TGA movements: is the government drawing down cash?
BTC $85k test or $90k reclaim attempt: does it hold or fail?
VIX behaviour: is volatility peaking or just getting started?
Bottom line
Crypto is stuck in macro’s waiting room. Bitcoin’s $85-95k range reflects a market with no conviction, not oversold enough to panic, not strong enough to break out. The next meaningful move won’t come from crypto-native catalysts. It’ll come from Tokyo or Washington.
The three key events:
Fed meeting on January 29 - Powell’s tone on cuts, inflation, and financial conditions will set the narrative for Q1
Japan’s February 8 election - determines whether fiscal expansion accelerates (forcing BOJ action and carry trade unwind)
US shutdown resolution - determines TGA trajectory and near-term liquidity conditions
Until more information from these to reprice, expect continued rangebound chop with elevated volatility. The 1.5-day lag between macro headlines and BTC price action tells you everything about current market structure: thin participation, low conviction, purely reactive positioning.
Now currently in the waiting room. The next 10 days determine whether we’re building toward a relief rally or a deeper February correction.