


The cryptocurrency market witnessed its largest liquidation event in history early last week, with over $2.25 billion in positions wiped out in a matter of hours. Sending shockwaves through the digital asset space causing major assets to plummet >40%.

Rather than a sign of market weakness, this massive deleveraging event offers a detailed view into the maturation of crypto market infrastructure and potentially signals an important inflection point for the broader digital asset space. From DeFi protocols processing hundreds of millions in liquidations without issue to the clear hierarchy of selling pressure across market caps, the patterns emerging from this correction merit careful analysis.
The Anatomy of the Crash
What we witnessed wasn't just a regular market correction - it was a perfect storm of multiple factors converging at once. The trigger came from an unexpected direction: President Trump's announcement of aggressive new tariffs.
A 25% duty on Canada and Mexico
10% tariff on Chinese imports
This sent shockwaves through global markets. The situation intensified when Trump's administration threatened 100% tariffs on BRICS nations if they pursued a competing currency initiative.

The market response was swift and brutal. Ethereum crashed 40%, plummeting from $3,500 to $2,100 in what seemed like a heartbeat. While Bitcoin showed remarkable resilience, dropping only 4%, the broader altcoin market faced devastating losses ranging from 30-40%. The resulting cascade of liquidations exceeded $2 billion, making it the largest such event in crypto history.
The Dollar Connection
The U.S. Dollar Index (DXY) and crypto markets have maintained a fascinating inverse relationship that has become one of the most reliable macro indicators in the digital asset space. Looking at the historical data we can see three major DXY surges that preceded significant Bitcoin price movements.

The 2018 DXY rally coincided with Bitcoin's fall
During the COVID panic of 2020, another DXY spike marked Bitcoin's bottom at $3,800
The most dramatic example came in 2022, when the DXY reached 114, perfectly timing Bitcoin's $15,500 low before its explosive recovery beyond $40,000.
This historic correlation between DXY and crypto isn't random - it reveals a fundamental truth about global capital movement and market psychology. During periods of uncertainty, investors traditionally flock to the U.S. dollar as a safe haven, causing the DXY to strengthen while simultaneously pulling capital from riskier assets like cryptocurrencies. Crypto markets, being at the far end of the risk spectrum, tend to experience these shifts most dramatically.

However, the current DXY movement tells a more nuanced story. While we're seeing immediate dollar strength in response to Trump's trade policies, a comparison with the 2016 post-election period suggests this might be temporary. The overlay chart tracking DXY movements after Trump elections shows remarkably similar patterns between 2016 and 2024. More importantly, it indicates that despite short-term spikes, the broader trajectory typically bends toward dollar weakness over time. This historical context suggests that while the dollar might act as a temporary headwind for crypto and other risk assets, the longer-term trend could actually support a market recovery once the initial shock of trade policy changes subsides.
DeFi Resilience
Aave
In what became the largest liquidation event in crypto history, Aave emerged as a beacon of stability. The protocol successfully processed $210 million in liquidations without accumulating any additional bad debt - a remarkable feat during such extreme market conditions.
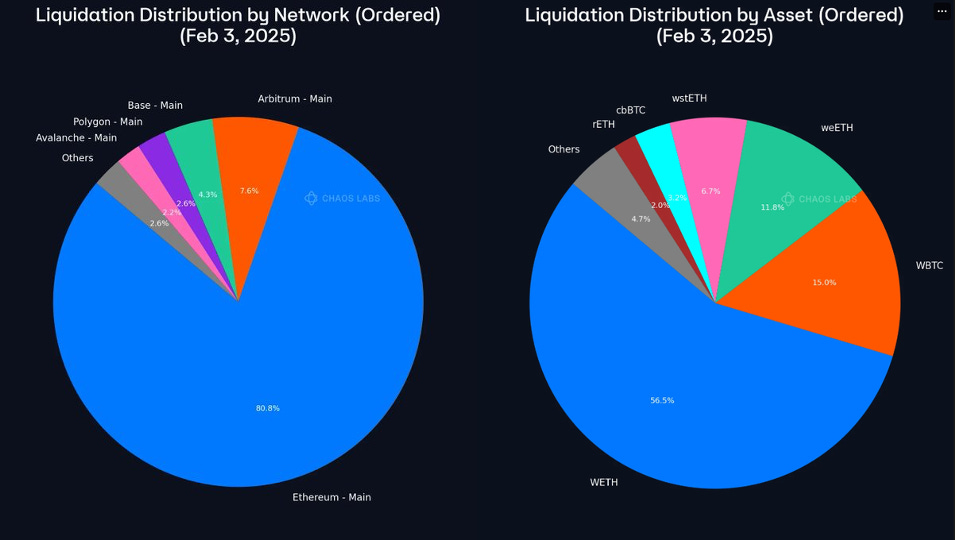
Even more impressively, Aave's existing bad debt decreased by 2.7% during the turmoil, showcasing the robustness of its liquidation mechanisms. The majority of liquidations occurred on Ethereum mainnet, with the protocol's risk management systems working exactly as designed to protect lenders and maintain system stability.
Maple Finance
Maple Finance's, a key institutional player, performance during the crash highlighted the evolution of DeFi risk management. The protocol reported zero liquidations & 15 margin calls, across their main lending pools, with both their Blue Chip and High Yield Secured products maintaining full collateralisation throughout the volatility. Average collateralisation levels held steady at 165%, and the protocol actually saw $10 million in new deposits during the crash period. Borrowers demonstrated strong counterparty responsibility by proactively posting an additional $7.4 million in collateral, suggesting a maturing market infrastructure where participants actively manage their positions.
Market Sentiment Analysis
A deep dive into the recent market crash reveals several classic bottoming signals emerging simultaneously. Two key metrics in particular stand out as historically reliable indicators of market extremes and potential turning points.
I. First, the Fear and Greed Index has plummeted to 35, firmly in the "Fear" zone. This marks a dramatic shift from last week's neutral reading of 47 and represents one of the sharpest sentiment drops since September 2024's yearly low of 26.
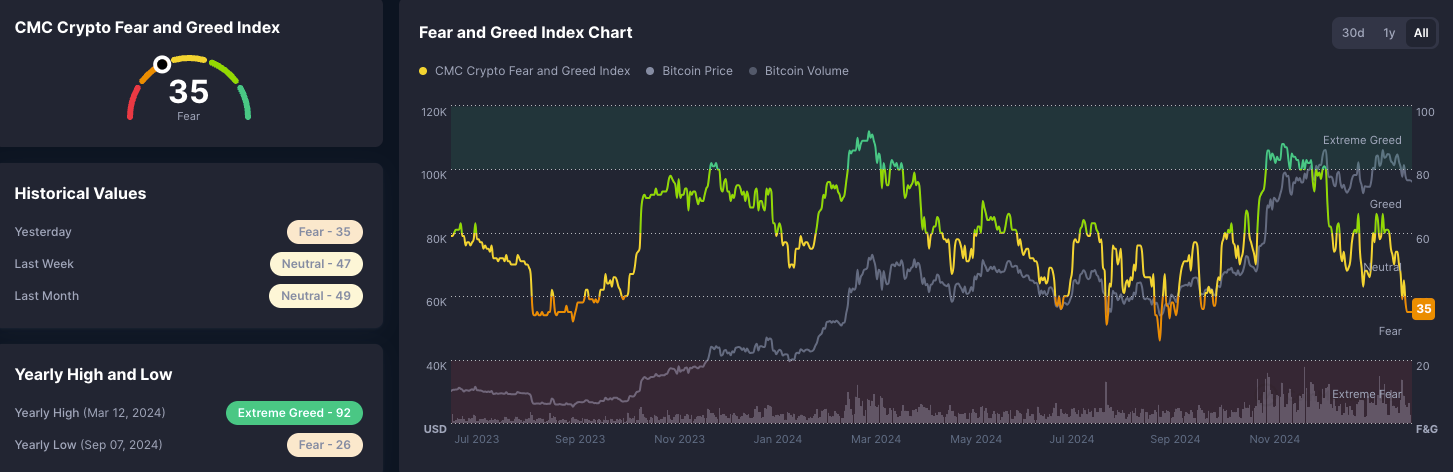
Such rapid shifts into fear territory have historically marked important market turning points.
II. The relative performance metrics paint a stark picture of Bitcoin's market dominance during this correction. According to the Top N vs BTC Index, which tracks the top 200 cryptocurrencies by market capitalization, a mere 22% of protocols have managed to outperform Bitcoin over the past 90 days.

When examining the performance by market cap groups, we see a clear pattern of risk reduction, with smaller cap cryptocurrencies (ranks 100-200) experiencing the steepest declines relative to Bitcoin.
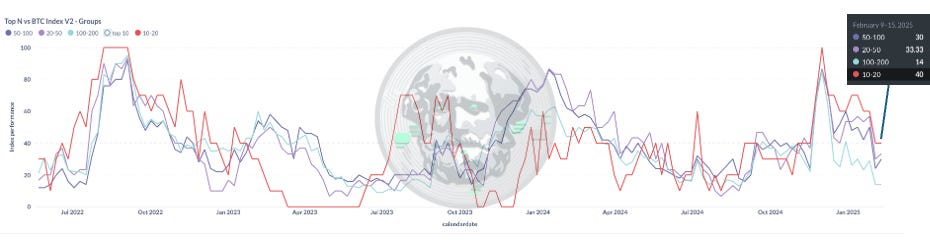
This tiered selloff pattern, where larger caps maintain relative stability while smaller caps face intense selling pressure, has historically emerged during major market bottoming processes, as seen in both October 2022 and July 2023 before significant recoveries.
Looking Ahead
The technical landscape presents two critical indicators worth monitoring. First, the OTHERS/BTC relationship is testing a multi-year trendline that dates back to 2016, suggesting we're at a pivotal point for altcoin performance relative to Bitcoin.
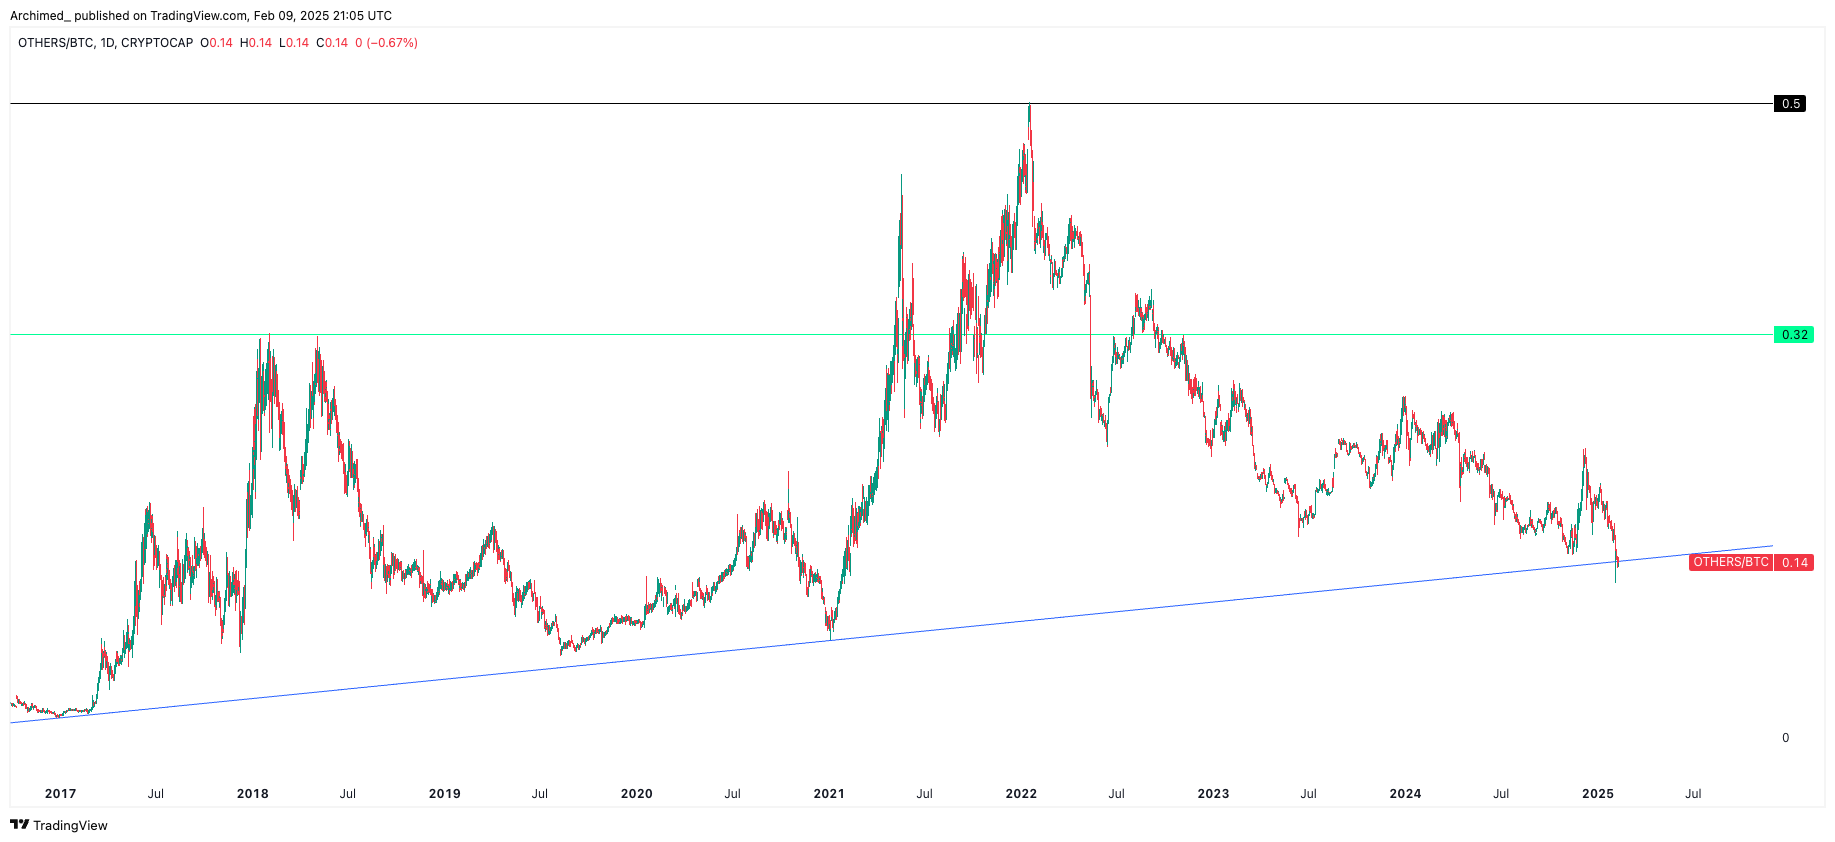
A breakdown below this support could signal further rotation into Bitcoin, while a bounce might indicate a broader market recovery.
Second, the total market capitalisation (excluding stablecoins) chart reveals significant technical levels that could come into play.
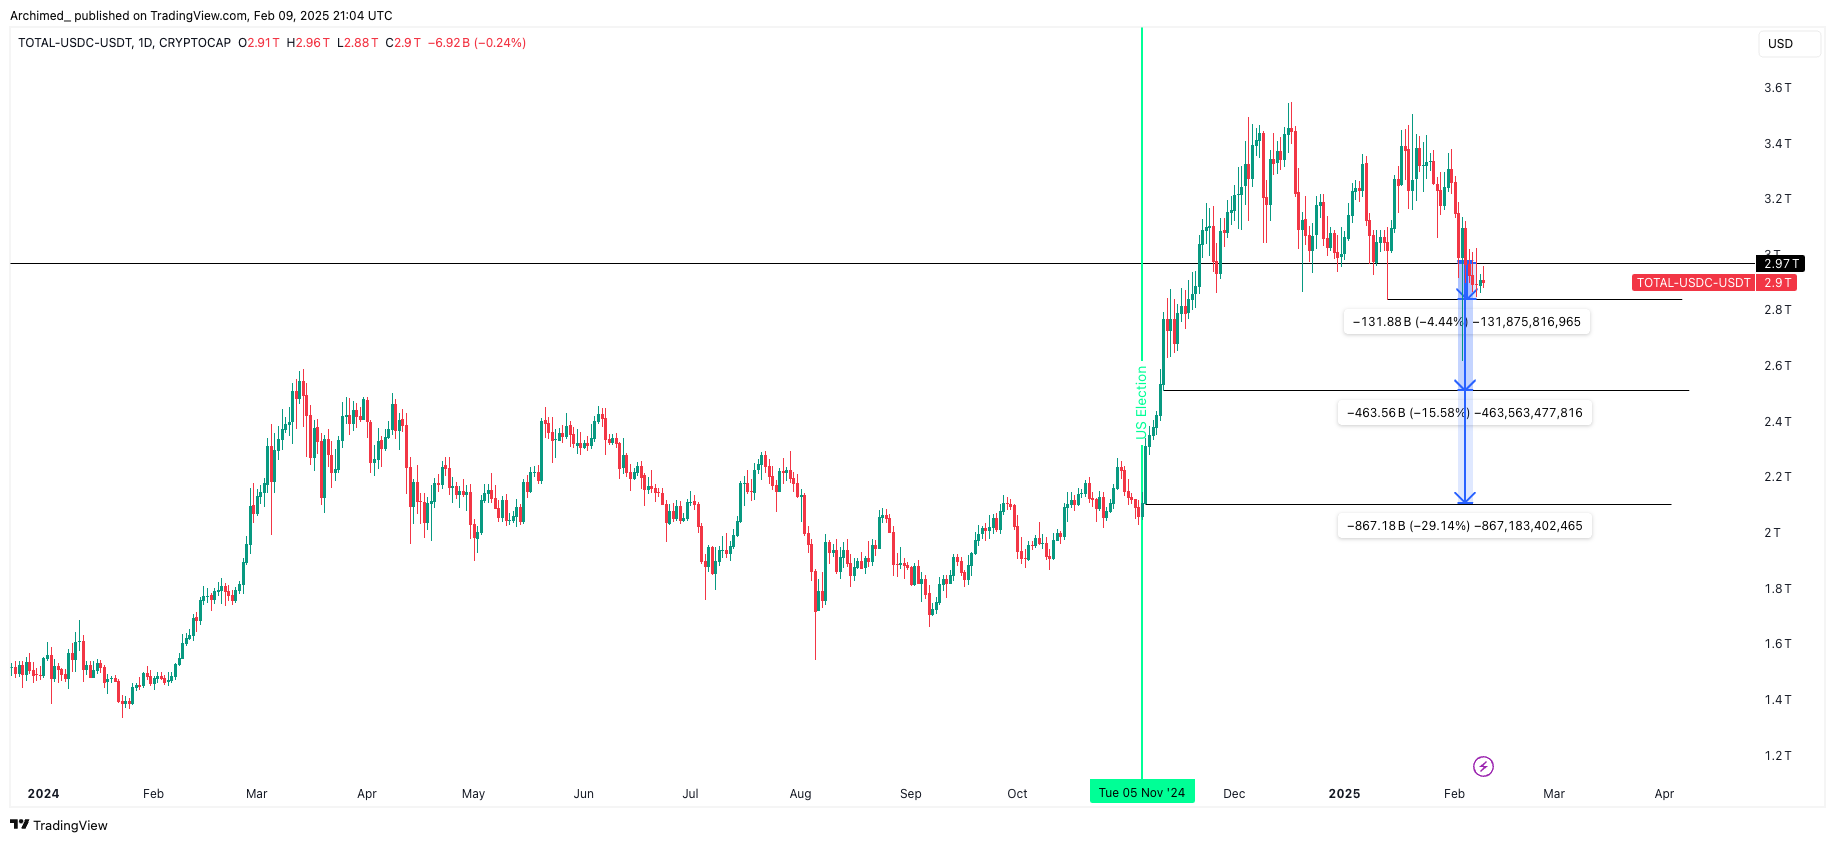
The market has already tested 2025 lows, with potential further drawdowns to mid euphoria post election. If those are broken it opens up for pre-election levels. These levels align with historical support zones and could present significant accumulation opportunities if reached.
Current conditions suggest we're entering a period of price discovery and consolidation. While short-term headwinds from trade tensions and dollar strength suggest caution is warranted, the medium-term outlook remains constructive given improving market infrastructure, institutional adoption, and historical precedent for strong recoveries following similar liquidation events.
Looking beyond immediate market dynamics, we're focusing on the medium term where strong cash flow generation, demonstrated product-market fit, and tangible value creation will be key differentiators. We see particularly attractive opportunities in mid to small-cap names, where high-quality protocols are trading at significant discounts to their intrinsic value following the recent market turbulence.